
Descripción
Este ALGORITMO es una herramienta técnica avanzada 🔧 diseñada para automatizar la detección de patrones geométricos de precios (Patrones Armónicos) y estructuras de mercado basadas en la acción del precio. Su objetivo principal es identificar zonas potenciales de reversión de tendencia de alta probabilidad 📍.
https://chartshots.spotware.com/c/693330cd99c57
¿Qué hace este algoritmo?
El algoritmo escanea el gráfico en tiempo real 🔍 buscando formaciones específicas de precio. Funciona en dos niveles:
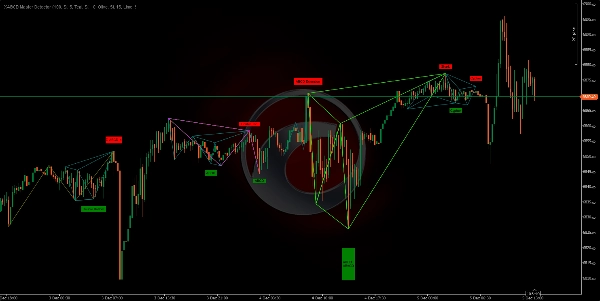
- Mapeo de Estructura (ZigZag): Primero, simplifica el ruido del mercado dibujando líneas "ZigZag" que conectan máximos y mínimos relevantes (pivotes). Usa hasta 4 longitudes diferentes simultáneamente 📏 para capturar tanto tendencias pequeñas (a corto plazo) como grandes (a largo plazo).
- Reconocimiento de Patrones: Una vez identificados estos puntos pivote (puntos A, B, C, D, X), el algoritmo mide las distancias y proporciones entre ellos. Si estas proporciones coinciden con las reglas matemáticas de patrones clásicos de trading (como Fibonacci), el indicador dibuja el patrón y alerta al usuario 🚨.
¿Para qué sirve?
Sirve para eliminar la subjetividad al trazar patrones complejos y ahorrar tiempo de análisis ⏳. En lugar de medir manualmente cada retroceso y extensión de Fibonacci, el indicador lo hace automáticamente para:
- Detectar Reversiones: Encontrar puntos donde el precio podría girar (de alcista a bajista o viceversa). 🔄
- Identificar Puntos de Entrada: Señalar zonas precisas (la "Zona Potencial de Reversión") para entrar al mercado. 🎯
- Confirmar Análisis: Servir como confluencia adicional para tu propia estrategia de soporte/resistencia.
Lógica detrás de los cálculos
El núcleo del indicador se basa en Proporciones de Fibonacci y simetría del mercado ⚖️. El algoritmo verifica reglas estrictas para cada patrón. Por ejemplo, para confirmar un patrón "Gartley", el algoritmo calcula internamente:
- Si el retroceso del punto B respecto a la pierna XA es exactamente (o muy cercano a) 0.618.
- Si la proyección del punto D cumple proporciones específicas.
El indicador permite un pequeño margen de error (configurable) porque el mercado rara vez es perfecto hasta el pip exacto. También calcula el ratio Riesgo/Recompensa teórico antes de mostrar un patrón.
Patrones que detecta:
https://chartshots.spotware.com/c/6933314cb9fa1
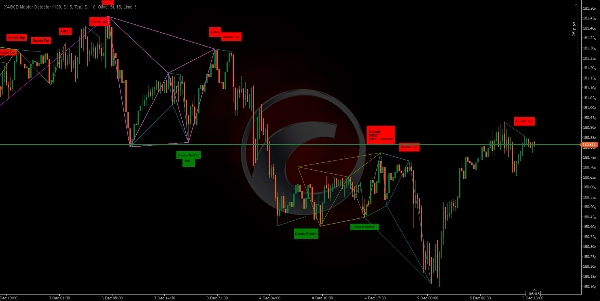
- Clásicos: Doble Techo y Doble Suelo. 🏔️🏞️
- Armónicos: Gartley, Murciélago 🦇, Mariposa 🦋, Cangrejo 🦀, Cangrejo Profundo, Tiburón 🦈, Cypher.
- Estructuras ABCD: ABCD clásico, AB=CD, ABCD extendido.
- Exóticos: Tres Impulsos, 5-0.
https://chartshots.spotware.com/c/6933317ae4324
¿Cómo usarlo?
Configuración Visual:
- Verás líneas coloreadas que conectan picos y valles.
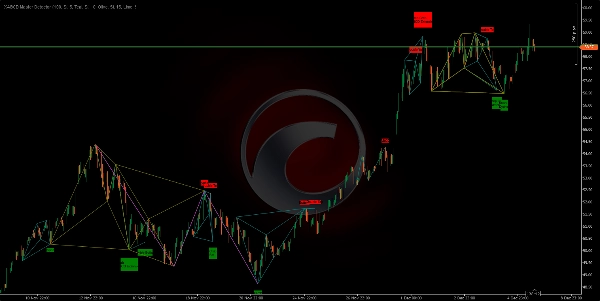
- Cuando un patrón esté completo, aparecerá una figura geométrica coloreada y una etiqueta con el nombre del patrón (por ejemplo, "Gartley", "Doble Techo").
- Etiquetas Verdes: Indican patrones alcistas (buscar compras). 📈
- Etiquetas Rojas: Indican patrones bajistas (buscar ventas). 📉
Interpretación:
- No operes cada etiqueta ciegamente. Úsalo como una señal de alerta.
- Cuando aparezca un patrón, espera a que el precio reaccione en la zona D (el último punto del patrón).
- Busca confirmación adicional (como una vela japonesa de reversión o divergencia en el RSI) antes de entrar.
Ajustes Clave:
- Puedes activar o desactivar patrones específicos si solo quieres operar algunos (por ejemplo, solo "Murciélago" y "Gartley"). ✅
- Puedes ajustar la sensibilidad de los ZigZags para ver movimientos más rápidos o tendencias más lentas. ⚙️
🏆 ¡Más de 10,000 Traders Confían en Nuestra Suite de Más de 25 Algoritmos! 🏆
Desde Estructura de Mercado y Liquidez hasta Sistemas de Salida Inteligentes y Herramientas Predictivas - hemos construido TODAS las herramientas que necesitas para ser consistente.
👉 Accede a Todos los Más de 25 Sistemas PROBADOS:
_______________________________________________
📌 Indicadores de Estructura de Mercado
· ✅ AdvancedMarket Structure: Bos, Choch, SwinLevels, Order Blocks, Market Structure& Liquidity Finder
· 🔄 Dynamic Market StructureAnalysis of Turning Points
· 🧱 Order Block
· ⚖️ Market Imbalance
· ⛓️ BOS & CHOCH
· 🧠 ICT Power of 3
_______________________________________________
🔚 Sistemas de Salida Inteligentes
_______________________________________________
📐 Indicadores ZigZag
· 🔍 ZigZag Price LiquidityProjection
· ➖ ZigZag
_______________________________________________
🧱 Indicadores de Soporte y Resistencia
· 🟩 SmartTrend Support &Resistance Lines
· 🧱 All Support and ResistanceLevels
_______________________________________________
📊 Indicadores de Tendencia y Canal
· 📊 Supertrend
_______________________________________________
💧 Herramientas de Volumen y Liquidez
_______________________________________________
⚡ Indicadores de Momentum y RSI
· 🔎 Multi-Level Candle Bias
Tracker
_______________________________________________
🔮 Herramientas de Predicción y Proyección
· 📐 Predicción basada en Linreg& ATR
· 📏 Regresión Lineal FibonacciMultitemporal
· 📈 Proyector de Flujo de Mercado Potenciado por Volumen_________________________
_________________________________________________________________________________________________
_________________________________________________________________________________________________
DISPARADOR DE CANAL RSI: 📶
Qué es: Un indicador que calcula el RSI(periodo) y marca visualmente zonas de momentum cuando el RSI cruza los umbrales de sobrecompra/sobreventa (por defecto 70/30). ✅
https://chartshots.spotware.com/c/69278f8b6d973
Lógica: Cuando se cruza un umbral, crea una "zona" basada en el máximo/mínimo de la vela en el momento del cruce. Luego: 🧠
- Colorea las velas dentro de esa zona.
- Dibuja un canal (alto, bajo, medio).
- Marca el cruce en el panel RSI con un círculo y una etiqueta.
La zona dura exactamente MinZoneDuration velas. ⏱️
Señales claras:
- Cruce por encima de Sobrecompra → inicia una zona alcista. 🟢
- Cruce por debajo de Sobreventa → inicia una zona bajista. 🔴
La zona en sí es un área de interés, no una orden.
https://chartshots.spotware.com/c/69278fb274e0b
Cómo usarlo (rápido):
- Espera a que se forme la zona. 🎯
- Confirma con acción del precio (ruptura/rechazo de las líneas del canal).
- Entra con un stop loss fuera de la zona y un objetivo en la línea media del canal o un ratio Riesgo/Recompensa definido.
https://chartshots.spotware.com/c/69278fe76237b
Parámetros clave: ⚙️
- Periodo RSI (14)
- Sobrecompra (70)
- Sobreventa (30)
- MinZoneDuration (15)
- Colores configurables 🎨
Resumen
The algorithm recognizes classic and complex patterns—including Double Top/Bottom, Gartley, Bat, Butterfly, Crab, Deep Crab, Shark, Cypher, ABCD structures, and exotic patterns like Three Drives and 5-0—by measuring distances and Fibonacci ratios between pivot points. Upon pattern completion, it visually displays colored geometric figures and labels indicating bullish (green) or bearish (red) signals.
Users can customize pattern detection and ZigZag sensitivity to suit their trading preferences. The indicator supports various markets such as Forex, commodities, indices, stocks, and cryptocurrencies, including symbols like EURUSD, GBPUSD, BTCUSD, XAUUSD, NAS100, and USDJPY.
XABCD Master Detector aims to reduce subjectivity and save analysis time by automatically calculating Fibonacci retracements, extensions, and theoretical risk/reward ratios. It serves as an alert tool to detect reversals, identify entry points, and provide additional confluence to existing support/resistance strategies.
Valoraciones de clientes
5 | 100 % | |
4 | 0 % | |
3 | 0 % | |
2 | 0 % | |
1 | 0 % |


![Logotipo de "[Stellar Strategies] Smart ADX"](https://cdn.ctrader.com/image/webp/af13b084-b6f6-41db-b7bc-c7e688b57b05_36929)


