

OrderFlow Absorption Matrix
Indicador
1 compras
Versión 1.0, Jul 2026
Windows, Mac
Desde 23/06/2025
1
Ventas
Descripción
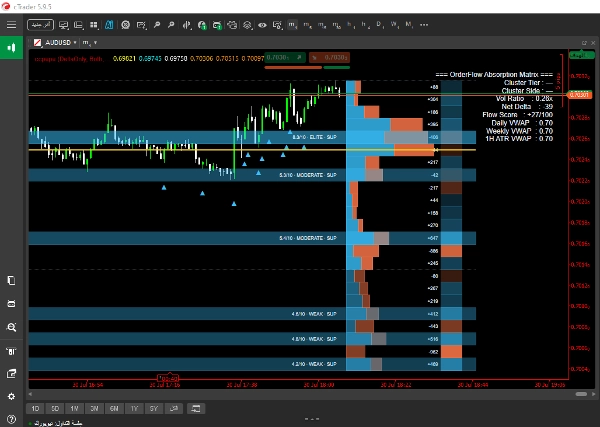
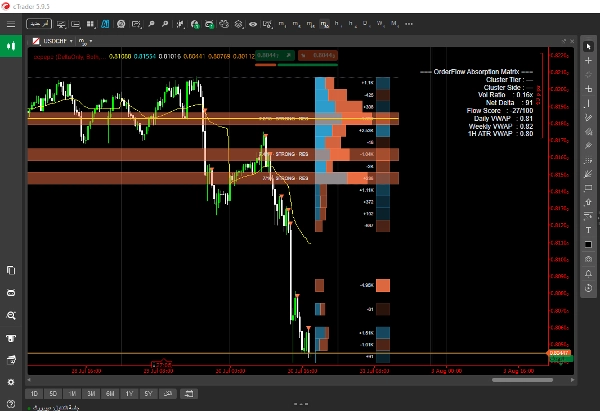
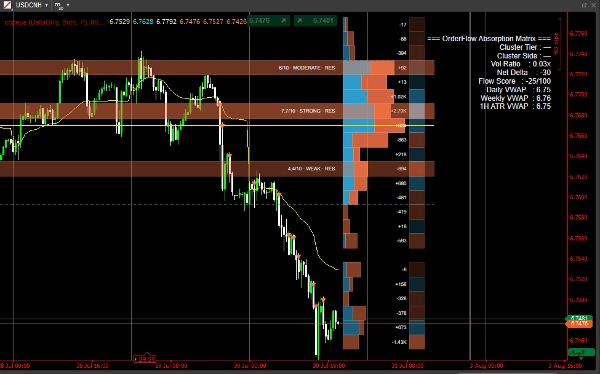
1️⃣ Flujo de órdenes y detección de delta
- Perforación en marcos temporales inferiores (LTF): El indicador inspecciona los datos de velas de marcos temporales inferiores (por ejemplo, barras de 1 minuto) dentro de cada barra actual para calcular:
-
- Delta neto: La diferencia neta entre el volumen de compra y venta.
- Absorción: Volumen pesado negociado en los extremos de la barra que no logra empujar el precio más allá, señalando grandes órdenes límite pasivas que absorben la liquidez del mercado.
- Detección de huellas de ballenas: Utiliza percentiles dinámicos calculados a través de tres ventanas de retroceso distintas (corta, media, larga) combinados con un motor de consenso personalizable para aislar verdaderos picos de volumen institucional.
2️⃣ Motor adaptativo de perfil de volumen
- Segmentación de bins: Segmenta el rango histórico de precios (Lookback Bars) en bins de precio verticales iguales.
- Distribución de volumen: Separa el volumen de compra, volumen de venta y delta por bin, mostrando barras de perfil horizontales proporcionales en el lado derecho del gráfico.
- Manejo dinámico del marco temporal: En lugar de depender de ticks fijos en segundos, el indicador evalúa dinámicamente los intervalos reales de las barras (
GetCurrentBarSpan). Esto previene el colapso del perfil o la distorsión de líneas a través de marcos temporales no estándar y pausas en la sesión del mercado (como gaps nocturnos en el mercado de acciones). - Cálculo del área de valor y POC:
-
- POC (Punto de Control): Identifica el nivel de precio con mayor volumen y lo resalta con una línea ancla prominente.
- Área de valor (VA): Aísla dinámicamente el porcentaje central de volumen (por ejemplo, 70%) y dibuja el Valor Alto del Área (VAH) y el Valor Bajo del Área (VAL).
3️⃣ Sistema de puntuación de zonas multifactoriales ponderadas
Cada bin de precio se evalúa continuamente usando una fórmula multifactorial ponderada con puntuación de 1 a 10:
Score=w1⋅Volume+w2⋅Absorption+w3⋅Touches+w4⋅Rejections+w5⋅Recency
- Perfilado automático de zonas: Los niveles con puntuaciones altas (Elite o Fuerte) se proyectan en el gráfico como zonas dinámicas de soporte/resistencia con insignias numéricas de fuerza en tiempo real.
4️⃣ Señales VWAP ancladas y disparadores de ejecución
- Calcula líneas de referencia VWAP ancladas a cambios temporales clave (inicio del día, semana y mes).
- Analiza cruzadamente la acción del precio relativa a los VWAP anclados junto con disparadores de clúster de alto volumen para trazar flechas de entrada precisas directamente en el gráfico.
5️⃣ Panel de análisis en pantalla
Un HUD limpio y en tiempo real ubicado en cualquier esquina del gráfico que elijas proporciona un resumen inmediato de las condiciones del mercado:
- Nivel de clúster: Clasificación de la barra actual (Ballena, Medio, Pequeño).
- Lado del clúster y delta neto: Sesgo direccional de liquidez y números precisos de delta.
- Ratio de volumen: Volumen actual relativo a promedios móviles.
- Puntuación de flujo: Una puntuación normalizada de momentum/flujo de órdenes que varía de −100 a +100.
- Referencias VWAP: Valores en tiempo real para niveles VWAP activos
Resumen
Resumen de IA
OrderFlow Absorption Matrix is an advanced indicator for cTrader that provides detailed order flow and volume profiling to identify institutional trading activity. It analyzes lower timeframe candle data to calculate net delta (buy vs. sell volume) and absorption, highlighting heavy volume at bar extremes where price fails to move further, indicating large passive limit orders. The indicator detects significant volume spikes ("Whale Prints") using dynamic percentiles across multiple lookback windows combined with a consensus engine.
It features an adaptive volume profile engine that segments historical price ranges into equal bins, displaying buy volume, sell volume, and delta per bin with proportional horizontal bars. The profile dynamically adjusts for varying timeframes and market session breaks, calculating key levels such as Point of Control (highest volume price) and Value Area (core volume range).
A weighted multi-factor scoring system continuously evaluates price bins based on volume, absorption, touches, rejections, and recency, projecting high-scoring zones as dynamic support/resistance levels with numeric strength indicators. Anchored VWAP lines are calculated for key time anchors (day, week, month) and combined with volume cluster triggers to plot precise entry signals.
An on-screen analytics dashboard provides real-time summaries including cluster tier classification, directional delta, volume ratios, momentum scores, and VWAP benchmarks, aiding in market condition assessment and trade decision-making.
It features an adaptive volume profile engine that segments historical price ranges into equal bins, displaying buy volume, sell volume, and delta per bin with proportional horizontal bars. The profile dynamically adjusts for varying timeframes and market session breaks, calculating key levels such as Point of Control (highest volume price) and Value Area (core volume range).
A weighted multi-factor scoring system continuously evaluates price bins based on volume, absorption, touches, rejections, and recency, projecting high-scoring zones as dynamic support/resistance levels with numeric strength indicators. Anchored VWAP lines are calculated for key time anchors (day, week, month) and combined with volume cluster triggers to plot precise entry signals.
An on-screen analytics dashboard provides real-time summaries including cluster tier classification, directional delta, volume ratios, momentum scores, and VWAP benchmarks, aiding in market condition assessment and trade decision-making.
Perfil del indicador
Categoría del indicador
Estadísticas
Tipo de resultado
Filtro
Requisitos de datos
Datos de tic
Señales admitidas
Ruptura de nivel
Toque de nivel
Inversión
Divergencia
Conversación
Valoraciones de clientes
0.0
Valoraciones: 0
Valoraciones de clientes
Este producto todavía no se ha valorado. ¿Ya lo ha probado? Sea el primero en informar a otros.
Preguntas frecuentes
Bollinger Bands
Key Levels
Volume
Supply & Demand
VWAP
Support & Resistance
Los productos disponibles a través de cTrader Store, incluidos bots, indicadores y plugins para operar, son proporcionados por desarrolladores de terceros y están disponibles únicamente con fines informativos y de acceso técnico. cTrader Store no es un bróker, por lo que no proporciona asesoramiento de inversión, recomendaciones personales ni ninguna garantía de rentabilidad futura.
Más de este autor


















Precio
Desde 23/06/2025
1
Ventas