
Descripción
| ALL IN ONE TRADING PRO|
## ¿Qué es este indicador?
Este indicador coloca **tres herramientas de trading útiles** en tu gráfico al mismo tiempo. Piénsalo como tener tres traders expertos dándote su opinión simultáneamente
=====================================================
## Las tres herramientas
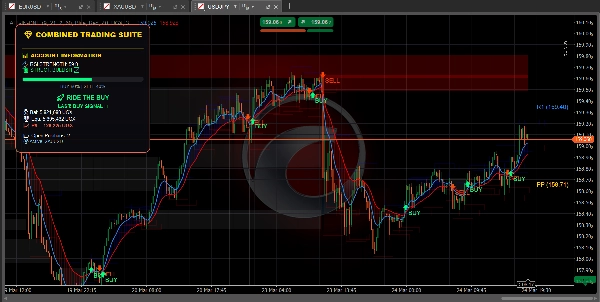
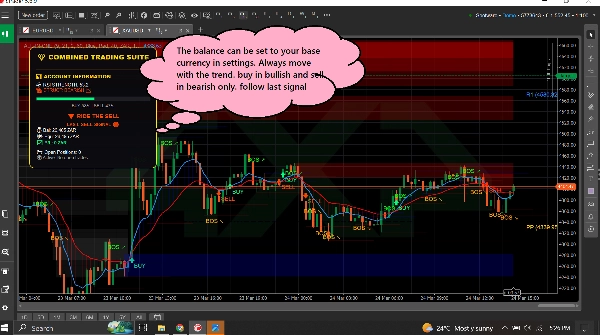
### 1. PANEL DE TENDENCIAS (El Rastreador de Tendencias)
**Qué hace:** Te indica hacia qué dirección se mueve el mercado y qué tan fuerte es el movimiento.
**Lo que ves:**
- **Línea azul** = Media móvil rápida (tendencia a corto plazo)
- **Línea roja** = Media móvil lenta (tendencia a largo plazo)
- **Nube azul** = Tendencia alcista (precio subiendo)
- **Nube roja** = Tendencia bajista (precio bajando)
- **Flecha verde** = Aparece señal de COMPRA
- **Flecha roja** = Aparece señal de VENTA
- **Barra RSI** = Muestra si el mercado está sobrecomprado (demasiado alto) o sobrevendido (demasiado bajo)
========================================================
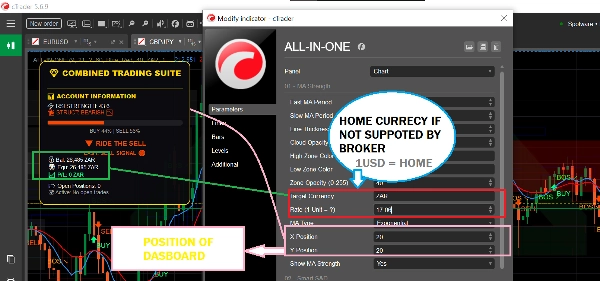
**También muestra:**
- El saldo de tu cuenta y ganancias/pérdidas
- Cuántas posiciones tienes abiertas
- Consejos simples en texto como "SEGURO PARA COMPRAR" o "APROVECHA LA COMPRA"
============================================================
### 2. ZONAS DE OFERTA Y DEMANDA (El Buscador de Niveles Clave)
**Qué hace:** Encuentra niveles de precio importantes donde el mercado podría revertir o detenerse.
**Lo que ves:**
- **Cajas azules** = Zonas de demanda (áreas donde entran compradores - BUENO para comprar)
- **Cajas rojas** = Zonas de oferta (áreas donde entran vendedores - BUENO para vender)
- **Cajas grises** = Zonas que han sido probadas (menos confiables)
============================================================
**Cómo usar:**
- ¿El precio baja hacia una caja azul? Busca COMPRAR
- ¿El precio sube hacia una caja roja? Busca VENDER
- Las cajas frescas (brillantes) funcionan mejor que las grises
============================================================
**También muestra:**
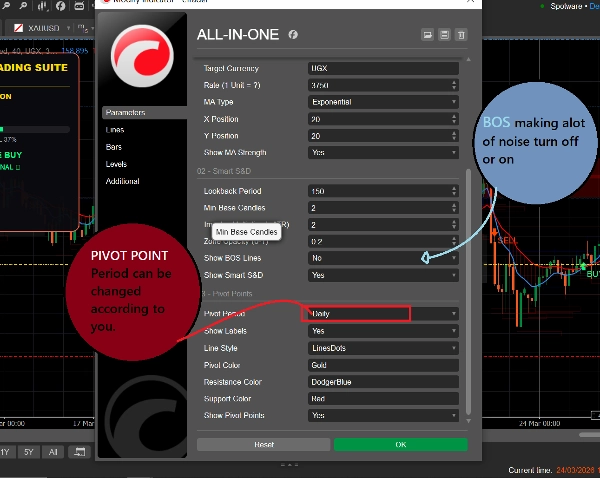
- **BOS ↗** = El mercado rompió al alza, la tendencia puede continuar hacia arriba
- **BOS ↘** = El mercado rompió a la baja, la tendencia puede continuar hacia abajo
============================================================
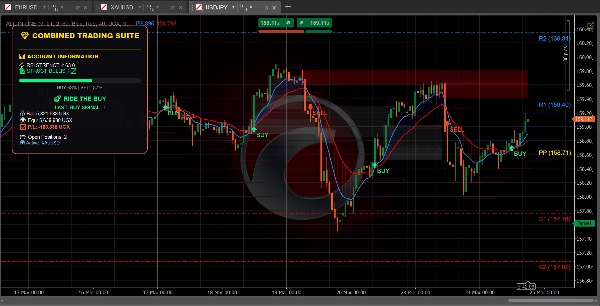
### 3. PUNTOS PIVOTE (Los Niveles de Soporte y Resistencia)
**Qué hace:** Calcula niveles de precio automáticos donde el mercado suele detenerse o girar.
**Lo que ves:**
- **Línea dorada** = Punto pivote (nivel central)
- **Líneas azules** = Niveles de resistencia (el precio puede bajar aquí)
- **Líneas rojas** = Niveles de soporte (el precio puede subir aquí)
============================================================
**Puedes elegir:**
- **Diario** = Los niveles cambian una vez al día
- **Semanal** = Los niveles cambian una vez a la semana
- **Mensual** = Los niveles cambian una vez al mes
- **15 minutos** = Los niveles cambian cada 15 minutos (bueno para trading rápido)
============================================================
## Cómo usarlo (Simple)
### Para encontrar una operación de COMPRA:
1. Espera a que el precio alcance una **caja azul de demanda**
2. Verifica si la línea MA azul está por encima de la línea MA roja (tendencia alcista)
3. Las señales deben seguirse solo si el mercado está en la tendencia correcta
============================================================
### Para encontrar una operación de VENTA:
1. Espera a que el precio alcance una **caja roja de oferta**
2. Verifica si la línea MA roja está por encima de la línea MA azul (tendencia bajista)
3. Las señales deben seguirse solo si el mercado está en la tendencia correcta
============================================================
### Para encontrar operaciones rápidas:
1. Usa puntos pivote de 15 minutos para niveles precisos
2. Observa las flechas BOS para la dirección de la tendencia
3. Revisa el panel para la fuerza del mercado
4. Toma operaciones que coincidan con la dirección
============================================================
## Qué significan todos los colores
| Color | Qué significa |
| 🟦 Azul | Señales alcistas / de compra / zonas de demanda / pivotes de resistencia |
| 🔴 Rojo | Señales bajistas / de venta / zonas de oferta / pivotes de soporte |
| 🟨 Dorado | Punto pivote (nivel central) |
| ⚪ Gris | Zonas probadas (ya visitadas) |
| 🟢 Flecha verde | Señal de COMPRA |
| 🔴 Flecha roja | Señal de VENTA |
============================================================
## Configuraciones simples para principiantes
============================================================
### Para trading rápido (Scalping):
- Periodo pivote: **15 minutos**
- MA rápida: **5**
- MA lenta: **13**
- Activa: Las tres herramientas
============================================================
### Para trading diario:
- Periodo pivote: **Diario**
- MA rápida: **9**
- MA lenta: **21**
- Activa: Las tres herramientas
============================================================
### Para trading a largo plazo:
- Periodo pivote: **Semanal**
- MA rápida: **21**
- MA lenta: **55**
- Activa: Panel de tendencias + puntos pivote
=========================================================
## Una regla para recordar
=========================================================
**¡No operes cuando las herramientas no estén de acuerdo!**
Si el panel dice COMPRA, pero el precio está en una zona roja de oferta - espera claridad.
Si el panel dice VENTA, pero el precio está en una zona azul de demanda - espera claridad.
Las mejores operaciones ocurren cuando TODAS las herramientas apuntan en la misma dirección.
============================================================
## Inicio rápido
1. Añade el indicador a tu gráfico
2. Mantén todas las configuraciones por defecto para comenzar
3. Observa cómo se comporta el precio en las cajas y líneas coloreadas
4. Después de unos días, ajusta las configuraciones para que coincidan con tu estilo
5. Usa el panel para monitorear tu cuenta en tiempo real
============================================================
¡Eso es todo! Tres herramientas, un indicador, trading simple.
Resumen
1. Trend Dashboard: Displays short-term (blue line) and long-term (red line) moving averages, colored clouds indicating uptrend (blue) or downtrend (red), buy (green arrow) and sell (red arrow) signals, and an RSI bar showing overbought or oversold conditions. It also shows account balance, open positions, and simple text advice.
2. Supply & Demand Zones: Highlights important price levels with blue boxes for demand zones (buying areas), red boxes for supply zones (selling areas), and gray boxes for tested zones (less reliable). It includes breakout signals (BOS arrows) indicating potential trend continuation.
3. Pivot Points: Automatically calculates support and resistance levels with a gold pivot point line, blue resistance lines, and red support lines. Users can select pivot periods from 15-minute to monthly intervals for different trading styles.
The indicator supports multiple markets including Forex, Crypto, Stocks, and Indices, and provides visual signals such as crossovers, breakouts, and level touches. It is designed for various trading styles, from scalping to long-term trading, with recommended settings for each. The tool emphasizes trading only when all three components align in direction to improve trade clarity and consistency.
Valoraciones de clientes
5 | 100 % | |
4 | 0 % | |
3 | 0 % | |
2 | 0 % | |
1 | 0 % |


