
설명
VOLUME PROFILE 업데이트 버전
이전 버전과 비교하여, 이 업데이트된 버전에는 중요한 버그 수정, 새로운 기능 및 상당한 성능 향상이 포함되어 있습니다:
수정 사항
- 볼륨 분포 수정: 모든 터치된 레벨에 100% 할당 대신 캔들 겹침에 따른 비례 할당
- VAH/VAL 감지 수정: 고정 값 대신 레벨 높이에 따른 허용 오차 조정
- 텍스트 위치 수정: 고정된 일수 대신 동적 시간 프레임 기반 오프셋
- DateTime 검증 수정: 빈 바 확인, 범위 벗어난 값 검증
기능
- DateTime 프로필용 시간대 오프셋 매개변수 추가
- 룩백 모드용 텍스트 위치 매개변수(왼쪽/오른쪽) 추가
- DateTime 모드 레이블이 이제 바 가장자리(가변 너비)를 따르거나 프로필 가장자리(전체 너비)에 정렬됨
성능
- DateTime 인덱스 조회를 위한 이진 검색 (기존에는 O(n) 선형)
- 총 볼륨 계산 캐싱 (기존에는 레벨별 재계산)
- 크기 조정 방지를 위한 사전 크기 지정된 TPO 사전
- 사전 조회를 위한 TryGetValue 패턴
- 핫 경로에서 foreach 대신 인덱스 기반 루프 사용
정리
- ProfileWidth 매개변수 제거 (자동 계산이 항상 정확함)
- 캔들 교차 조건 단순화
__________________________________________________________________________________________
중요 참고 사항 - 먼저 읽어주세요
외환 거래 볼륨은 실제 볼륨이 아닙니다
외환 거래의 볼륨은 틱 볼륨입니다 — 가격이 변한 횟수를 셉니다. 거래된 금액을 세는 것이 아닙니다.
틱 볼륨이 보여주지 못하는 것
- 거래 크기. 100달러 거래와 1,000만 달러 거래 모두 1틱으로 계산됩니다.
- 실제 자금 흐름. 큰 돈이나 작은 돈이 가격을 움직였는지 알 수 없습니다.
- 진정한 유동성. 시장에 대기 중인 주문 수를 볼 수 없습니다.
- 은행 활동. 은행은 실제 볼륨 데이터를 봅니다. 여러분은 볼 수 없습니다.
이것이 의미하는 바
틱 볼륨은 가격이 얼마나 자주 변했는지만 보여줍니다 — 그 뒤의 자금은 보여주지 않습니다. 이로 인해 문제가 발생합니다:
- 은행이나 기관을 추적할 수 없습니다. 그들은 여러분이 접근할 수 없는 실제 볼륨 데이터를 사용합니다.
- "스마트 머니" 이론을 증명할 수 없습니다. 그런 아이디어는 틱 수가 아닌 실제 볼륨이 필요합니다.
- 진정한 유동성을 판단할 수 없습니다. 틱 활동은 주문 깊이나 실제 시장 강도를 보여주지 않습니다.
- 실제 매수 또는 매도 세력을 측정할 수 없습니다. 많은 작은 거래가 하나의 큰 기관 거래와 똑같이 보입니다.
- 볼륨 급증은 거짓일 수 있습니다. 급증은 실제 거래 관심이 아닌 알고리즘 노이즈일 수 있습니다.
이 지표를 올바르게 사용하는 방법
- 돈 측정기가 아닌 활동 측정기로 취급하세요. 높은 틱 볼륨 = 시장이 바쁨. 낮은 틱 볼륨 = 시장이 조용함. 그 이상은 아닙니다.
- 다른 시간대 간 활동을 비교하세요. 런던 세션이 뉴욕보다 바쁜지, 오늘이 어제보다 활동적인지, 추세 기간이 횡보보다 바쁜지 확인하는 데 사용하세요.
- 가격 구조와 결합하세요. 지지/저항, 스윙 포인트 또는 BOS/ChoCH를 볼륨과 함께 사용하세요. 가격 컨텍스트는 노이즈가 많은 볼륨 급증으로 인한 잘못된 신호를 방지합니다.
- 중요한 가격 레벨에서 활동을 관찰하세요. 가격이 주요 레벨을 테스트하고 틱 볼륨이 증가하면 더 많은 트레이더가 활동 중임을 의미합니다. 큰 플레이어가 개입했다는 뜻은 아닙니다.
- 기관 활동을 나타낸다고 가정하지 마세요. 틱 볼륨은 축적, 대량 주문 또는 "스마트 머니"를 보여줄 수 없습니다. 리듬과 템포를 측정하는 데만 사용하세요.
__________________________________________________________________________________________
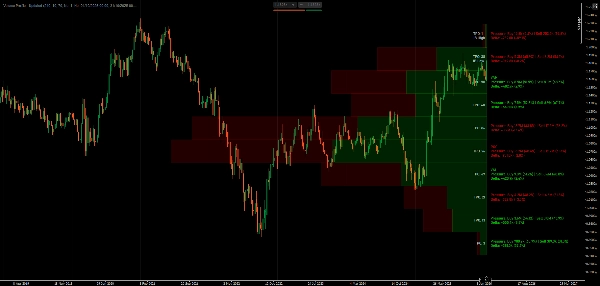
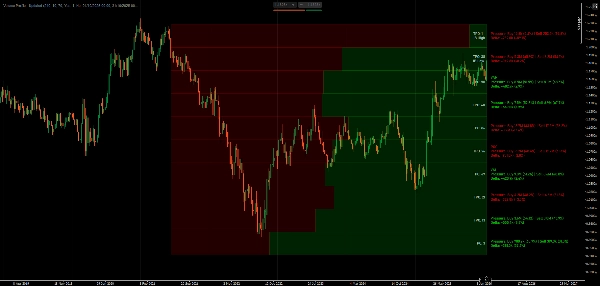
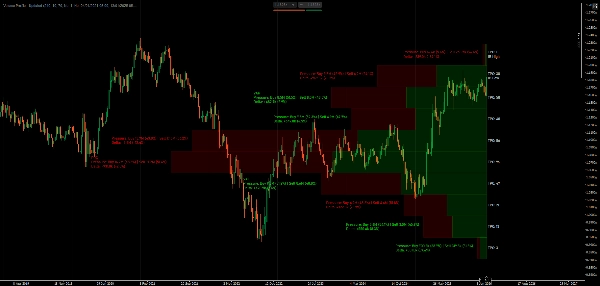
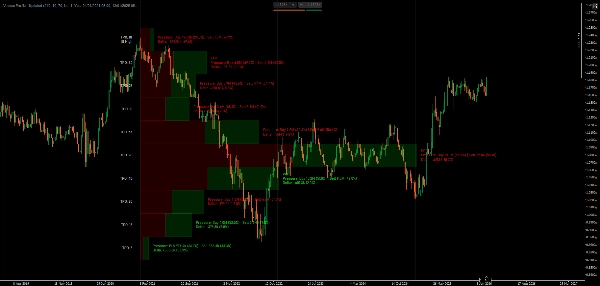
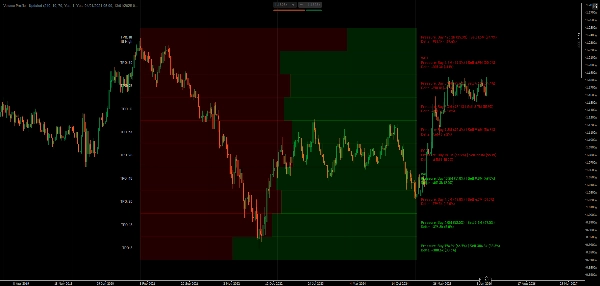
POC, 가치 영역 및 시장 프로필 TPO 추적로 볼륨 분포 및 가격별 체류 시간 시각화.
이 지표는 시장 프로필 개념을 사용하여 볼륨 분포를 보여줍니다. 최고 틱 활동 레벨인 제어점(POC), 대부분의 거래가 발생한 가치 영역 경계, 각 가격에서 체류 시간을 나타내는 TPO 문자 시퀀스, 캔들 방향별 틱 활동을 분할하는 델타 시각화를 표시합니다.
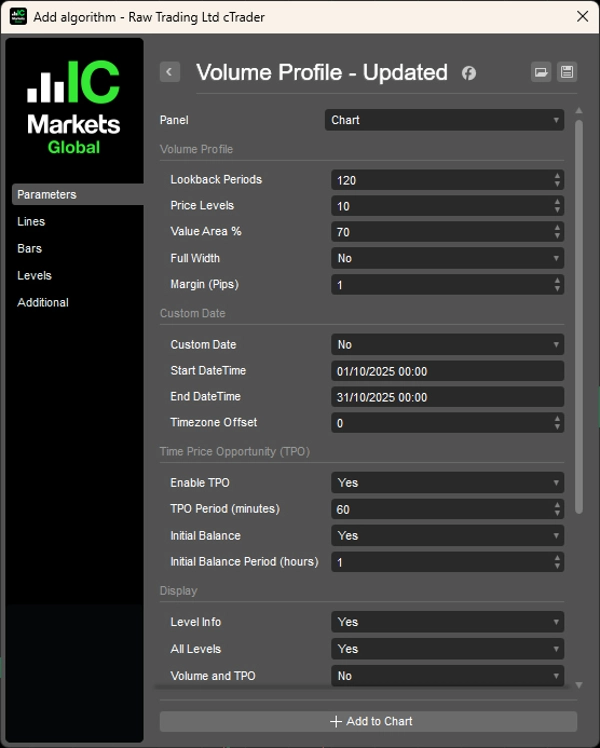
룩백 기간을 선택하거나 특정 날짜 범위를 설정할 수 있으며, 볼륨 바를 비례 또는 전체 너비로 표시하고, 모든 레벨 또는 주요 레벨만 토글하며, 강세/약세 활동에 대한 색상을 사용자 지정할 수 있습니다.
기능
볼륨 분포 분석
- 제어점(POC): 가장 높은 활동이 있는 가격 레벨—가격이 가장 오래 머문 곳
- 가치 영역(VA): 사용자 지정 가능한 활동 집중 구역(기본값 70%)—대부분의 거래가 발생한 곳
- VAH/VAL: 가치 영역 상한/하한 경계—잠재적 지지/저항 레벨
- 델타 시각화: 각 가격 레벨에서 캔들 방향을 분할하여 표시
시장 프로필 TPO
- 시간 가격 기회 추적: 각 가격에서 거래된 시간 기간 수 계산
- TPO 문자: 가격에서 체류 시간을 시각적으로 표현 (A-Z 순서)
- 초기 균형(IB): 첫 시간 범위—일간 거래 구조에 중요
- IB 상한/하한 표시기: 개장 범위 극한
유연한 룩백 옵션
- 기간 기반: 분석할 바 수 설정 (예: 최근 120 바)
- DateTime 범위: 이벤트 분석을 위해 특정 날짜/시간 사이에 프로필 고정
- 동적 너비: 자동 스케일 또는 고정 너비 프로필
표시 옵션
- 볼륨 바: 비례 너비(활동 스케일) 또는 전체 너비 균일 바
- 각 바 내 캔들 방향 분할
- 백분율 포함 델타 계산
- 모든 레벨 또는 주요 레벨만 토글 (POC, VAH, VAL)
- 볼륨/TPO 세부 정보 표시 제어
- 백분율 포함 방향별 분류
- 조정 가능한 글꼴 크기 및 핍 기반 여백
색상 사용자 지정
- 강세/약세 방향 바에 대한 독립 색상
- 양수/음수 델타에 대한 별도 텍스트 색상
- TPO 전용 텍스트 색상
성능 최적화
- 캐시된 시간 조회 및 효율적인 사각형 그리기
- 부드러운 성능을 위한 최소 재계산
- 캔들 구조 기반 전문 등급 델타 계산
__________________________________________________________________________________________
더 많은 무료 지표
구조와 볼륨부터 회귀, 변동성, 맞춤 시간 프레임에 이르기까지 다양한 시장 분석 도구를 탐색하세요.
소스 코드는 GitHub 저장소에서 확인할 수 있습니다.
모두 무료로 사용할 수 있습니다. 하지만 커피 지원을 보내고 싶다면 여기로 보내실 수 있습니다.
지지/저항
볼륨
이동 평균
- SSL 채널
- 고정 이동 평균
- 편차 스케일 이동 평균
- 갠 고저 활성기
- 즉시 추세선
- 트렌드 비전이 포함된 카우프만 적응형 MA
- 이동 평균 채널
- 이동 평균 스위트
- 트렌드 채널 이동 평균
유틸리티/커스텀
회귀 기반
변동성
오실레이터
__________________________________________________________________________________________
면책 조항
거래에는 위험이 따릅니다. 이 지표는 기술적 분석용으로만 의도되었으며 — 항상 적절한 위험 관리를 적용하고 책임감 있게 거래하세요.
피드백 및 개선 사항
제안, 기능 요청 또는 개선 아이디어가 있으면 토론 탭에 댓글을 남겨주세요. 여러분의 피드백은 모두를 위한 지표 개선에 도움이 됩니다.
요약
Key features include customizable lookback periods based on bar count or specific date/time ranges, dynamic or fixed profile widths, and display options for proportional or full-width volume bars. Users can toggle visibility of all levels or key levels (POC, VAH, VAL) and adjust colors independently for bullish/bearish bars and delta text. The indicator tracks Initial Balance (IB) ranges and marks IB High/Low for day trading structure.
Performance optimizations include binary search for DateTime lookups, cached volume calculations, and efficient data structures to minimize recalculations. The indicator uses tick volume, which counts price changes rather than actual traded volume, making it suitable as a market activity meter rather than a measure of real money flow or liquidity.
Supported markets include Forex, Indices, Commodities, Crypto, and Stocks. The indicator is intended for technical analysis and includes parameters for timezone offset and text positioning.
고객 리뷰
5 | 100 % | |
4 | 0 % | |
3 | 0 % | |
2 | 0 % | |
1 | 0 % |


!["[Stellar Strategies] QQE" 로고](https://cdn.ctrader.com/image/webp/e702104a-874c-4b39-97dd-fb34518d1015_27712)


