
Range 10 Rsi
Indicador
127 transferências
Versão 1.0, Aug 2025
Windows, Mac
Descrição
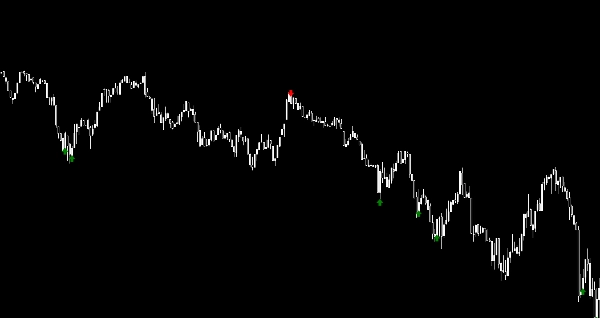
O cBot RSI Scalping automatiza todo o fluxo de trabalho de scalping: desde a detecção do sinal RSI até a execução da ordem e o gerenciamento da saída. Ele prospera na volatilidade, capturando movimentos de preço de curta duração em tempo real. Aproveite o scalping sem as mãos com precisão profissional.
Resumo
Resumo de IA
Range 10 RSI is an automated scalping indicator that uses the Relative Strength Index (RSI) to identify trading signals in volatile, choppy markets. It automates the entire scalping process, including signal detection, order execution, and exit management, enabling rapid trades that capture short-term price movements. Designed for hands-free operation, this tool aims to deliver precise and timely scalping actions based on real-time RSI analysis.
Perfil do indicador
Avaliações de clientes
0.0
Avaliações: 0
Avaliações de clientes
Ainda não há avaliações para este produto. Já o experimentou? Seja o primeiro a contar a outras pessoas!
Conversa
Perguntas frequentes
Os produtos disponíveis através da cTrader Store, incluindo bots de negociação, indicadores e plugins, são fornecidos por programadores terceiros e são disponibilizados apenas para fins informativos e de acesso técnico. A cTrader Store não é um corretor e não fornece aconselhamento em matéria de investimento, recomendações pessoais ou qualquer garantia de desempenho no futuro.


Preço
Desde 03/08/2025
127
Instalações gratuitas