Описание
Индикаторы Pinescriptlabs Store: 🤖Pinescriptlabs Store cBots : (cBot)
PRICE ACTION (New)
Gold & BTC BreakoutSession Pivots(new)
SmartTrend Support &
Resistance
Lines
Dynamic
Market Structure
Analysis
of
Turning Points
Fibonacci
Linear
Regression
Multi-timeframe
Multi-Level
Candle Bias
Tracker
Auto
Support and
Resistance
Trend
Lines
All
Support and
Resistance
Levels
Zig Zag Support & Resistance with Swings
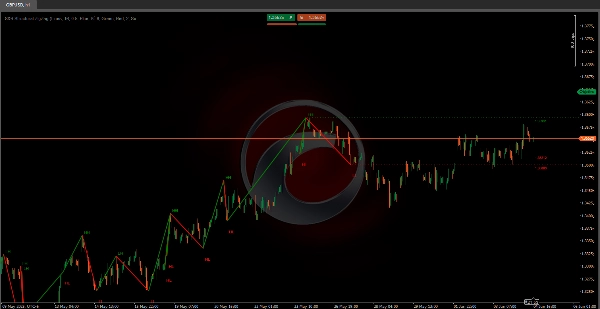
1. Что делает этот индикатор? ❓
🔍 Обнаруживает ценовые колебания (максимумы и минимумы)
- Сканирует последние бары ("Глубина анализа") для поиска самой высокой/низкой цены в этом диапазоне.
- Подтверждает колебания с помощью процентного порога (например, изменение на 1%+ по сравнению с последним колебанием) → Отмечает новые ✅ максимумы/минимумы колебаний.
- Снижает шум ⚡: Подтверждает колебания только если половина периода анализа проходит без более высокого максимума/более низкого минимума.
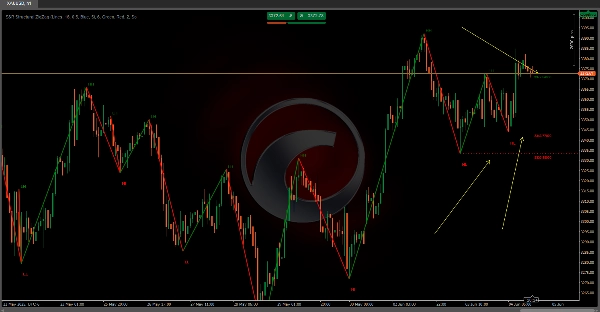
📉 Рисует трендовые линии Zigzag
- Соединяет колебания динамическими линиями:
-
- 🟢 Зеленый = Восходящий тренд (новое колебание > предыдущее).
- 🔴 Красный = Нисходящий тренд (новое колебание < предыдущее).
⏹️ Выделяет ключевые уровни
- Линии поддержки/сопротивления: Нарисованы на точной цене каждого колебания, продолжены вправо
- Метки показывают значения цены 📌 (например, "1.1050") для мгновенного анализа.
🚦 Раскрывает структуру рынка
- Определяет тренды с первого взгляда:
-
- Бычий = Высшие максимумы (HH) + Высшие минимумы (HL).
- Медвежий = Нижние максимумы (LH) + Нижние минимумы (LL).
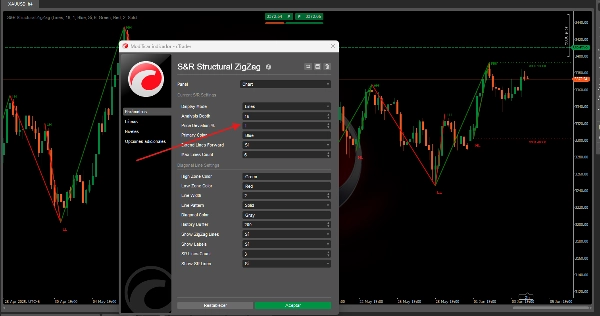
2. Как использовать (руководство по настройке) ⚙️
Установите на cTrader: Перетащите на ваш график!
Основные настройки:
- Глубина анализа 🔎:
10(по умолчанию) → Более высокие значения фильтруют шум; более низкие ловят больше колебаний. - Процент отклонения цены 📏:
1.0%(регулируется) → Мин. изменение цены для подтверждения колебаний. - Метки колебаний 🏷️ (HH/HL/LH/LL): Включить/выключить.
- Продлить линии ➡️: Проецировать уровни поддержки/сопротивления бесконечно или ограничить текущими барами.
Сводка
Отзывы покупателей
5 | 100 % | |
4 | 0 % | |
3 | 0 % | |
2 | 0 % | |
1 | 0 % |