Описание
Индикаторы Pinescriptlabs Store: Pinescriptlabs Store cBots : (cBot) Gold & BTC BreakoutSession Pivots(новый)
Trailing Smart Algorithm (Новый)
Карта Ликвидации Кредитного Плеча
Прогноз на основе Linreg & ATR
SmartTrend Поддержка и
Сопротивление
Линии
Сессии Разрыва Справедливой Ценности
Динамический
Анализ Структуры Рынка
Поворотных
Точек
Points
Фибоначчи
Линейная
Регрессия
Мульти-таймфрейм
Импульсный Разрыв Справедливой Ценности
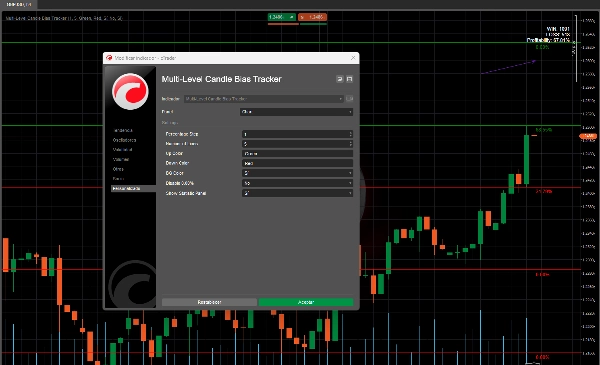
Многоуровневый
Трекер Смещения Свечей
Tracker
Авто
Линии Поддержки и
Сопротивления
Тренда
Lines
Все
Уровни Поддержки и
Сопротивления
Levels
Динамический Импульс Диапазона
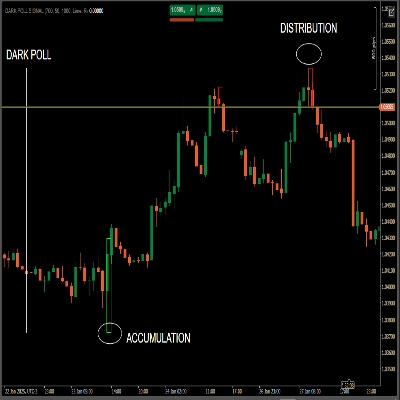
Этот алгоритм определяет вероятность достижения ценой нового максимума или минимума и отображает это как уровень на графике с соответствующим процентом. Этот расчет проверен на истории, и результаты показываются в таблице, что облегчает понимание вероятности того, что следующая свеча установит новый максимум или минимум. 📈📉
Как это работает? 🛠️
- Вероятности новых максимумов и минимумов 🎯
-
- Алгоритм анализирует прошлое поведение цены, чтобы вычислить вероятность того, что цена установит новый максимум или минимум в следующей свече.
- Например, если вероятность нового максимума 70%, то с большей вероятностью цена пойдет вверх. ⬆️
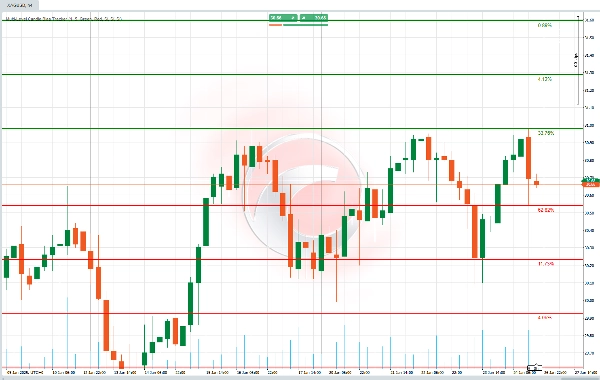
- Уровни с процентами 📏
-
- Он рисует горизонтальные линии на графике, представляющие ключевые уровни, с процентом, указывающим вероятность достижения цены этого уровня.
- Эти уровни рассчитываются с использованием процента, который вы задаете (например, 1%).
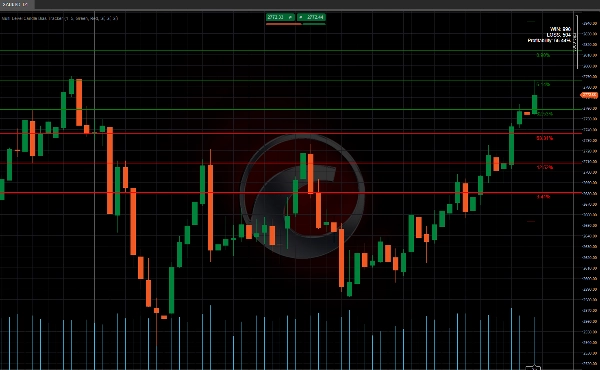
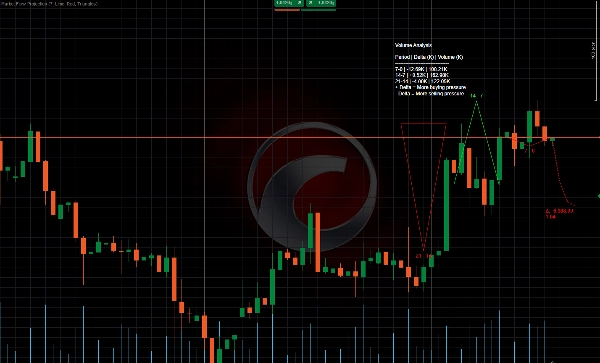
- Панель статистики 📊
-
- Она показывает, сколько раз цена достигала этих уровней (успехи) и сколько раз не достигала.
- Также предоставляется процент эффективности, показывающий, насколько эти уровни были надежными в прошлом. ✅❌
Для чего это нужно?
- Понимать направление цены: Помогает понять, с большей вероятностью цена пойдет вверх или вниз в следующей свече. ⬆️⬇️
- Управлять рисками: Если уровень имеет низкую вероятность, вы можете избегать его, чтобы снизить рискованные решения.
Как вы бы его использовали?
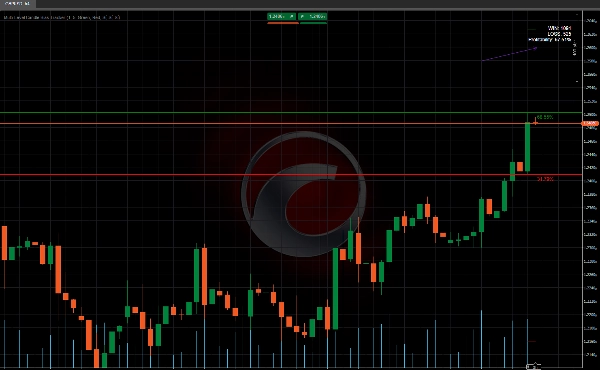
- Наблюдайте за уровнями: Смотрите на линии, которые алгоритм рисует на графике. 👀
- Проверяйте вероятности: Если уровень имеет высокую вероятность (например, 70%), с большей вероятностью цена его достигнет. 📈
- Используйте панель статистики: Проверьте, насколько хорошо эти уровни работали в прошлом, чтобы решить, доверять ли им. 📊
Сводка
The indicator includes a statistics panel that shows how many times the price has successfully reached these levels versus how many times it has not, along with an effectiveness percentage reflecting the reliability of these levels based on historical data.
This tool is designed to help traders understand the likely direction of price movement in the next candle and manage risk by avoiding levels with low probabilities. Users apply it by observing the drawn levels, checking their associated probabilities, and reviewing the statistics panel to assess the historical performance of these signals.
Supported markets include commodities, cryptocurrencies (e.g., BTCUSD), and other symbols. The indicator integrates probability-based analysis into price action trading to assist in decision-making regarding potential breakout or trend continuation scenarios.
Отзывы покупателей
5 | 100 % | |
4 | 0 % | |
3 | 0 % | |
2 | 0 % | |
1 | 0 % |