
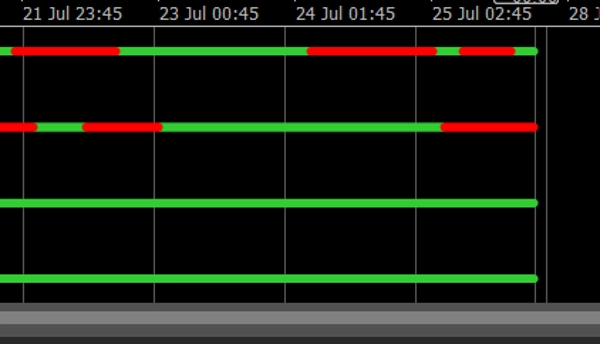
Multi Timeframe Trend Dots ist ein leistungsstarker und minimalistischer Trendindikator, der für cTrader entwickelt wurde. Er ermöglicht es Tradern, die Trendrichtung visuell zu verfolgen über bis zu 4 auswählbare Zeitrahmen mithilfe einfacher, aber effektiver farbcodierter Punktlinien.
✅ Grün = Aufwärtstrend
✅ Rot = Abwärtstrend
✅ Sauberes Layout in einem einzigen Unterfenster
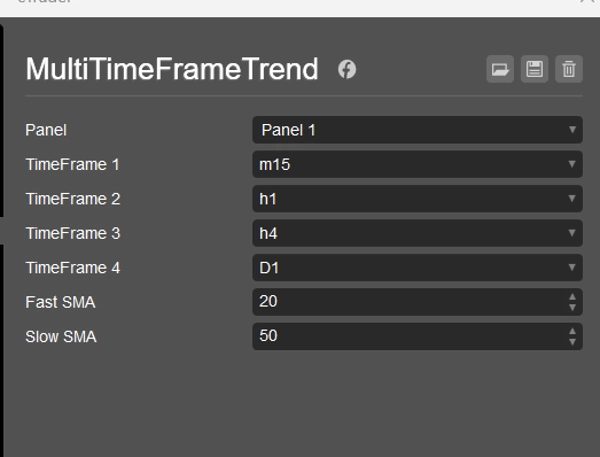
✅ Anpassbare SMA Schnell/langsam Einstellungen
✅ Funktioniert auf jedem Symbol und Zeitrahmen
Ob Sie ein Scalper, Intraday-Trader oder Swing-Trader sind, dieser Indikator bietet Ihnen einen schnellen Überblick über die Multi-Timeframe-Ausrichtung – ideal, um selbstbewusste Einstiege zu tätigen oder schlechte Setups herauszufiltern.
💼 Enthält:
- Trendslogik basierend auf SMA-Crossover
- 4-stufige Punktplatzierung (für bessere Lesbarkeit angepasst)
- Zeitrahmenbeschriftungen am Ende jeder Trendlinie
- Vollständig kompatibel mit allen cTrader-Versionen
🎁 Perfekter Begleiter für Strategieentwicklung oder manuelles Trading.
5 | 0 % | |
4 | 100 % | |
3 | 0 % | |
2 | 0 % | |
1 | 0 % |


