
HeatMap Candle
Chỉ báo
138 lượt tải
Phiên bản 1.0, Apr 2025
Windows, Mac
Mô tả
Nến Bản Đồ Nhiệt
Tóm tắt
Tóm tắt AI
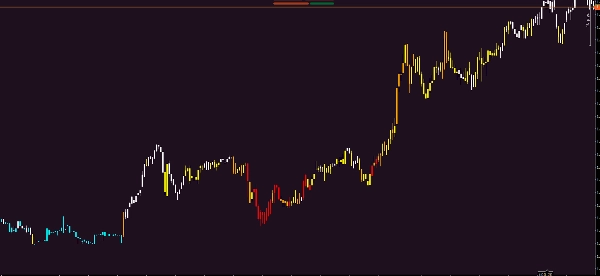
HeatMap Candle is a trading indicator designed to visually represent market data using a heatmap-style candle chart. It provides a graphical display that highlights price movements and intensity within candlestick patterns, aiding traders in analyzing market conditions. The indicator focuses on enhancing the interpretation of price action through color-coded heatmap visualization, which can help identify trends and potential turning points. It is suitable for integration into trading platforms that support custom indicators.
Hồ sơ chỉ báo
Đánh giá của khách hàng
0.0
Đánh giá: 0
Đánh giá của khách hàng
Sản phẩm này chưa có đánh giá nào. Bạn đã dùng thử chưa? Hãy là người đầu tiên chia sẻ với mọi người!
Thảo luận
Câu hỏi thường gặp
Các sản phẩm có sẵn trên cTrader Store, bao gồm bot giao dịch, chỉ báo và plugin, được cung cấp bởi các nhà phát triển bên thứ ba và chỉ nhằm mục đích cung cấp thông tin và tiếp cận kỹ thuật. cTrader Store không phải là nhà môi giới và không cung cấp lời khuyên đầu tư, khuyến nghị cá nhân hay bất kỳ đảm bảo nào về hiệu suất trong tương lai.
Sản phẩm khác của tác giả này


![Logo "Tabajara corrigido[fix]"](https://cdn.ctrader.com/image/webp/7f4bbef8-b245-4ebd-80d7-582fffc0c90c_28378)


Giá
Kể từ 10/02/2025
1.26K
Cài đặt miễn phí