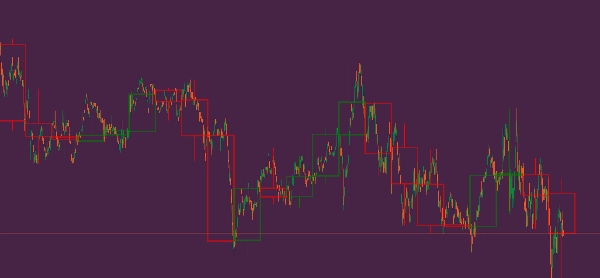
Nhà môi giới & tự doanh
Dành cho doanh nghiệp
00
Days
:
00
Hours
:
00
Minutes
:
00
Seconds
HTFOverlayPlus
Logo "HTFOverlayPlus"
Kể từ 10/02/2025
Cài đặt miễn phí
841
Ảnh "HTFOverlayPlus" được tải lên

Este indicador sobrepõe candles de um time frame superior sobre o gráfico do time frame atual. Ele permite visualizar até 50 candles de um time frame maior e ajusta a cor das velas de acordo com a direção do preço (alta ou baixa). O indicador oferece a possibilidade de personalizar a espessura das bordas do corpo das velas e as cores para velas de alta e baixa. Ele é útil para traders que desejam visualizar a ação do preço em time frames superiores enquanto operam em time frames menores, permitindo uma análise mais precisa das tendências. (Obs: funciona com corpo invisível apenas no time frame e o resto apenas pinta.)


This indicator overlays candles from a higher time frame onto the current chart time frame. It allows you to display up to 50 candles from a larger time frame and adjusts the candle color based on price direction (bullish or bearish). The indicator provides the option to customize the body thickness and the colors for bullish and bearish candles. It is useful for traders who want to visualize higher time frame price action while trading on smaller time frames, enabling more accurate trend analysis. (Note: only works with invisible body in the time frame and the rest just paints.)


Este indicador superpone velas de un marco temporal superior en el gráfico del marco temporal actual. Permite mostrar hasta 50 velas de un marco temporal mayor y ajusta el color de las velas según la dirección del precio (alcista o bajista). El indicador ofrece la posibilidad de personalizar el grosor de los bordes del cuerpo de las velas y los colores para las velas alcistas y bajistas. Es útil para los traders que desean visualizar la acción del precio en marcos temporales superiores mientras operan en marcos temporales más pequeños, lo que permite un análisis más preciso de las tendencias. (Nota: solo funciona con cuerpo invisible en el marco temporal y el resto solo pinta.)

0.0
Đánh giá: 0
Đánh giá của khách hàng
Sản phẩm này chưa có đánh giá nào. Bạn đã dùng thử chưa? Hãy là người đầu tiên chia sẻ với mọi người!
Sản phẩm khác của tác giả này
VWAP Tabajara
VWAP Tabajara
Larry Williams 9.1
Larry Williams 9.1
Tabajara corrigido[fix]
corrigido todos os bugs e cores invertidas tabajara antigo deleetado
Bạn cũng có thể thích
Chỉ báo
NAS100
NZDUSD
XAUUSD
+13
ORDERFLOW_SKIA_Plynuly
This Indicator will show you Direction, Distance, and Time;
Quantitative Qualitative Estimation
The QQE (Quantitative Qualitative Estimation) Weighted Oscillator improves its original version by weighting the RSI.
DMI MONDAY ZONES v2.1
Marks Monday's OPEN,HIGH & LOW. These are areas of support and resistance for the week.
Chỉ báo
Bollinger
E7 Indicators Free Studies
ADXR, KDJ, SineWave, Bollinger Band Volatility and AEOscillator.
Chỉ báo
RSI
Breakout
Supertrend
Market Trend OB
Price action to detect when the market changes trend (MSB) and defines, order blocks , ZigZag etc.📊
Chỉ báo
Grid
NAS100
RSI
+19
Delta-RSI Candle Pro
Delta RSI Candle Pro
Chỉ báo
Indices
Breakout
Prop
+4
Pivot Points Daily Session
Pivot Point with base zone daily Asia-London-New york Session.
Chỉ báo
Indices
Stocks
Commodities
+2
PRC Momentum Hybrid
a visually very powerful tool for analyzing "opposing forces".
VolumeRenkoRange
Volume for Renko/Range
FlexVWAPBand
Ultra-Flexible VWAP Indicator with Advanced Customization
[Hamster-Coder] Moving Average
Universal Moving Average indicator with extended features
Chỉ báo
NAS100
NZDUSD
XAUUSD
+11
Volume Profile Pro
Visualize trading volume by price within any range, highlight POC and key value areas.
Weekly Daily Levels
The Weekly Daily Levels indicator shows the OHLC, and mid-point prices for the previous day and week.
IR Macd + MacdLine
some user add moving average to macd to see better. in ctrader 4.3.11 there is a problem with this . I make a macd tha
Chỉ báo
Bollinger
Trend Channel Moving Average
Complete MA-channel system: colored trend, channel boundaries & equilibrium with 6 Fib zones.
Candles_Painter
Overlay HTF context on any chart: color bars by HTF and draw filled HTF bodies with optional High/Low lines.
IR Moving Average
 this moving include everything that a trader needs from Moving Average.
FairValueGap-PremiumVersion1
This Fair Value Gap (FVG) indicator is a technical analysis on multi-timeframe.