
Mô tả
🚀 Hơn 10.000 nhà giao dịch đã sử dụng các chỉ báo hàng đầu của chúng tôi 🏆
Khám phá lý do tại sao các chuyên gia chọn chúng tôi – những công cụ mạnh mẽ nhất trên cTrader (chỉ báo, thuật toán và cBots) đang chờ bạn.
👉 Nhận tất cả các hệ thống hàng đầu của chúng tôi tại đây:
_______________________________________________
📌 Chỉ báo Cấu trúc Thị trường
· 🔄 Phân tích Cấu trúc Thị trường Động của Điểm Quay
· 🧱 Order Block
· ⛓️ BOS & CHOCH
· 🧠 ICT Power of 3
_______________________________________________
🔚 Hệ Thống Thoát Thông Minh
· 📍 Thuật Toán Thông Minh Theo Sau
_______________________________________________
📐 Chỉ báo ZigZag
· 🔍 Dự Báo Thanh Khoản Giá ZigZag
· ➖ ZigZag
· 🎯 Bộ Theo Dõi Cực Đoạn Zig-Zag
_______________________________________________
🧱 Chỉ báo Hỗ Trợ & Kháng Cự
· 🟩 Đường Hỗ Trợ & Kháng Cự SmartTrend
· 🧱 Tất Cả Các Mức Hỗ Trợ và Kháng Cự
_______________________________________________
📊 Chỉ báo Xu Hướng & Kênh
· 📊 Supertrend
· ⚡Bộ Phân Tích Xu Hướng Động Lực
· ⭐ KÊNH SSL CAO CẤP
_______________________________________________
💧 Công Cụ Khối Lượng & Thanh Khoản
· 🔥 Bản Đồ Nhiệt POC Khối Lượng
· 🔍 Khoảng Cách Giá Trị Công Bằng Động Lực
· 🕒 Phiên Khoảng Cách Giá Trị Công Bằng
_______________________________________________
⚡ Chỉ báo Động Lực & RSI
· 🔎 Định Hướng Nến Đa Cấp
Bộ Theo Dõi
_______________________________________________
🔮 Công Cụ Dự Đoán & Chiếu Dự
· 📐 Dự Đoán Dựa Trên Linreg& ATR
· 📏 Hồi Quy Tuyến Tính Fibonacci Đa Khung Thời Gian
· 📈 Máy Chiếu Dòng Chảy Thị Trường Dựa Trên Khối Lượng
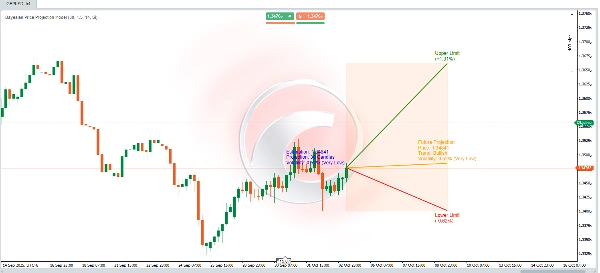
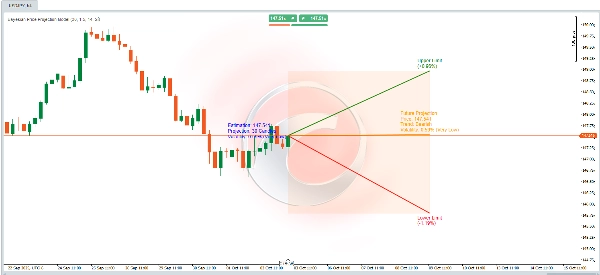
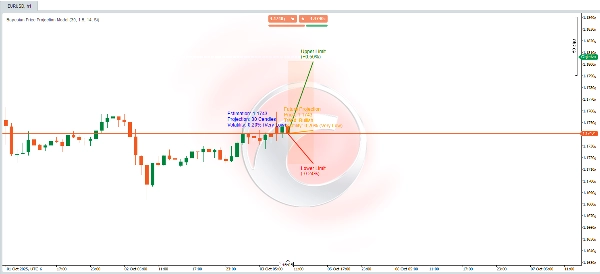
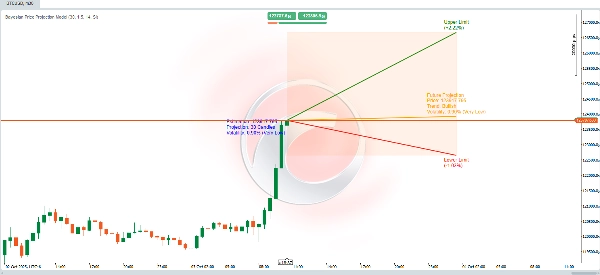
📊 Thuật Toán Chiếu Giá Động 📈
Thuật toán này kết hợp **tính toán thống kê**, **phân tích kỹ thuật** và **lý thuyết Bayes** để dự báo giá tương lai đồng thời cung cấp **khoảng không chắc chắn** thể hiện giới hạn trên và dưới. Các phép tính được thiết kế để điều chỉnh dự báo bằng cách xem xét **xu hướng** thị trường, **biến động** và xác suất lịch sử đạt đỉnh hoặc đáy mới.
Cách hoạt động như sau:
🚀 Dự Báo Giá Tương Lai
Một phép tính động ước lượng giá tương lai dựa trên ba yếu tố chính:
1. **Xu hướng**: Xác định thị trường có xu hướng đi lên hay đi xuống.
2. **Biến động**: Đo lường mức độ thay đổi dự kiến dựa trên dao động lịch sử.
🧠 **Điều Chỉnh Xác Suất Bayes**
- Xác suất có điều kiện được tính bằng **công thức Bayes**:
\[
P(A|B) = \frac{P(B|A) \cdot P(A)}{P(B)}
\]
Mô hình hóa các sự kiện tương lai dựa trên thông tin có điều kiện:
- **Xác suất đạt đỉnh cao nhất mọi thời đại mới** nếu giá đang có xu hướng tăng.
- **Xác suất đạt đáy thấp nhất mọi thời đại mới** nếu giá đang có xu hướng giảm.
- Những xác suất này tinh chỉnh ước lượng giá tương lai bằng cách xem xét:
- **Biến động cao hơn** làm tăng khả năng đạt mức cực đoan (đỉnh/đáy).
- **Xu hướng thị trường** ảnh hưởng đến hướng di chuyển giá dự kiến.
🌟 **Tính Toán Biến Động**
- Biến động được đo bằng chỉ báo **ATR (Average True Range)** với cửa sổ 14 kỳ. Điều này phản ánh biên độ dao động giá trung bình.
- Để biểu thị biến động dưới dạng phần trăm, ATR được chuẩn hóa bằng cách chia cho giá đóng cửa và nhân với 200.
- Biến động sau đó được phân loại thành các mức mô tả (ví dụ: **Rất Thấp**, **Thấp**, **Trung Bình**, v.v.) để dễ hiểu hơn.
---
🎯 **Giới Hạn Độ Lệch (Trên và Dưới)**
- Giới hạn trên và dưới tạo thành một **khoảng dự báo** xung quanh giá tương lai ước tính, cung cấp khung cho sự không chắc chắn.
- Những giới hạn này được tính bằng cách điều chỉnh ATR sử dụng:
- Một **hệ số nhân** do người dùng định nghĩa (`factor_desviacion`).
- **Xác suất Bayes** đã tính trước đó.
- **Căn bậc hai của khoảng thời gian dự báo** (`proyeccion_dias`), kết hợp nguyên tắc rằng sự không chắc chắn tăng theo thời gian.
🔍 **Diễn Giải Mô Hình**
Mô hình này có thể được xem như một **mô hình xác suất động** mà:
- Kết hợp **phân tích kỹ thuật** (xu hướng và ATR).
- Tinh chỉnh xác suất bằng **lý thuyết Bayes**.
- Cung cấp một **khoảng dự báo trực quan** giúp bạn hiểu các chuyển động giá tiềm năng trong tương lai và sự không chắc chắn liên quan.
⚡ Dù bạn đang phân tích **thị trường biến động** hay xác nhận các kịch bản **tăng/giảm giá**, công cụ này trang bị cho bạn một phương pháp dựa trên dữ liệu mạnh mẽ! 🚀


