
Mô tả
Lý thuyết Hộp Darvas
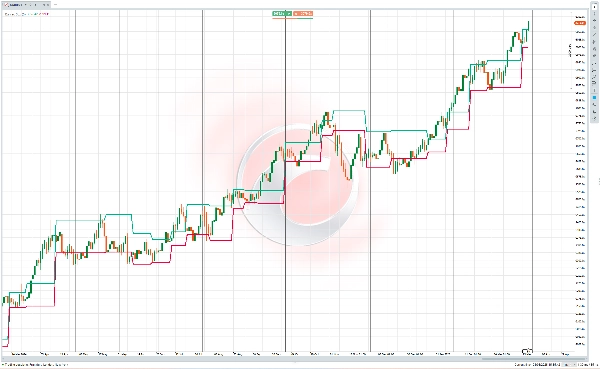
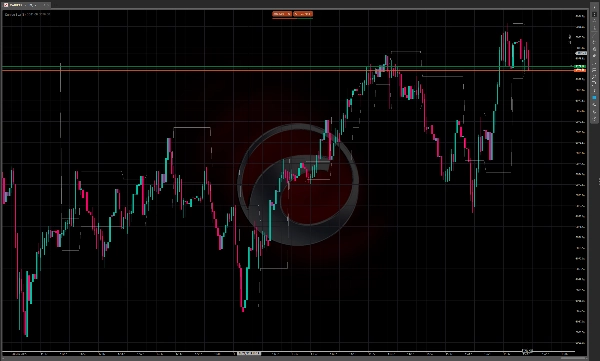
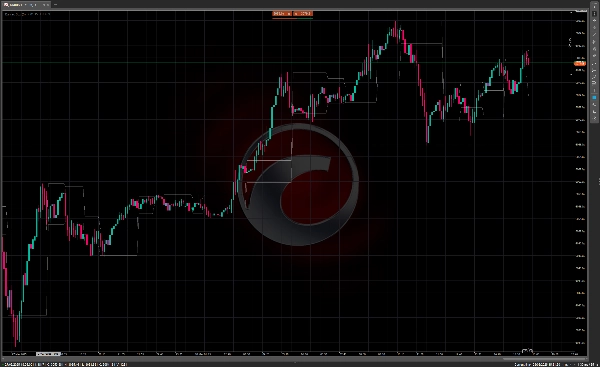
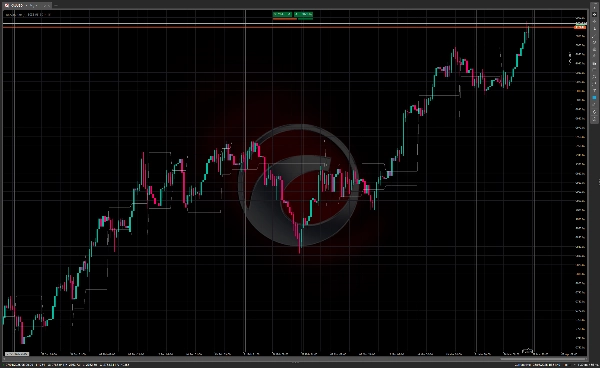
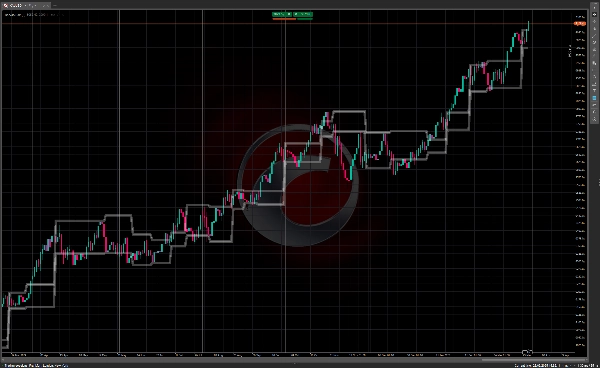
Lý thuyết Hộp Darvas là một kỹ thuật giao dịch được phát triển bởi Nicolas Darvas vào những năm 1950. Đây là một chiến lược giao dịch dựa trên động lượng sử dụng hành động giá để xác định các điểm vào và ra tiềm năng trên thị trường.
Cách thức hoạt động của Hộp Darvas
Phương pháp Hộp Darvas bao gồm việc xác định các "hộp" hoặc phạm vi giao dịch nơi giá cổ phiếu củng cố trước khi bứt phá. Các thành phần chính bao gồm:
- Giá tạo thành một phạm vi giao dịch xác định (gọi là "hộp") với các ranh giới trên và dưới rõ ràng
- Ranh giới trên đại diện cho kháng cự, trong khi ranh giới dưới đóng vai trò hỗ trợ
- Một sự bứt phá vượt lên trên hộp báo hiệu cơ hội mua tiềm năng
- Một sự phá vỡ xuống dưới hộp có thể được sử dụng như tín hiệu bán
Các nhà giao dịch sử dụng kỹ thuật này thường tìm kiếm các cổ phiếu có khối lượng tăng cùng với biến động giá, vì điều này cho thấy động lượng mạnh hơn đằng sau sự bứt phá.
Lịch sử của Lý thuyết Hộp Darvas
Nicolas Darvas (1920-1977) là một nhân vật khá đặc biệt trong lịch sử giao dịch. Sinh ra ở Hungary, ông không phải là một nhà giao dịch chuyên nghiệp theo đào tạo mà là một vũ công biểu diễn trong một cặp khiêu vũ phòng khiêu vũ có tên "Darvas và Julia" cùng với chị cùng cha khác mẹ của mình.
Trong khi đi lưu diễn khắp thế giới với đoàn múa của mình vào những năm 1950, Darvas bắt đầu thử nghiệm giao dịch cổ phiếu. Hoàn cảnh của ông rất đặc biệt — ông thường đưa ra các quyết định đầu tư chỉ dựa trên bảng giá cổ phiếu trong các tờ báo được gửi đến ông ở nhiều thành phố khác nhau trong chuyến lưu diễn.
Darvas phát triển lý thuyết hộp của mình thông qua thử và sai. Ban đầu, ông thua lỗ trên thị trường nhưng dần dần hoàn thiện phương pháp của mình. Từ năm 1956 đến 1958, ông được cho là đã biến khoản đầu tư 10.000 đô la thành hơn 2 triệu đô la bằng phương pháp hộp của mình — một thành tích phi thường đã thu hút sự chú ý.
Năm 1960, Darvas xuất bản phương pháp của mình trong cuốn sách "How I Made $2,000,000 in the Stock Market," trở thành một tác phẩm kinh điển trong văn học giao dịch. Cuốn sách chi tiết hành trình của ông và giải thích lý thuyết hộp, đưa phương pháp này đến sự chú ý rộng rãi.
Điều làm cho phương pháp của Darvas đặc biệt đáng chú ý là sự đơn giản và việc nó được phát triển bởi một người ngoài ngành tài chính. Ông tập trung chủ yếu vào hành động giá và khối lượng hơn là phân tích cơ bản, một cách tiếp cận khá mới mẻ vào thời điểm đó nhưng đã ảnh hưởng đến nhiều hệ thống giao dịch kỹ thuật sau này.
Kỹ thuật Hộp Darvas vẫn phổ biến trong giới nhà giao dịch kỹ thuật ngày nay, đặc biệt là những người theo các chiến lược dựa trên động lượng trong các thị trường có xu hướng.


![Logo "[Hamster-Coder] Moving Average MTF"](https://cdn.ctrader.com/image/webp/b11b98b1-194d-4b8e-b00e-d611826ad159_31226)


