
Descrizione
Puoi acquistare il cBot progettato attorno a questo indicatore e ad altri due indicatori a questo link: https://ctrader.com/it/products/1056?u=Labot
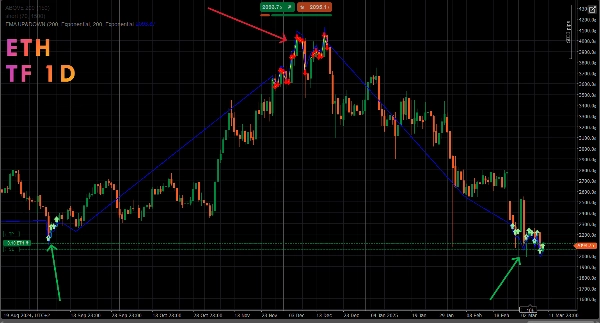
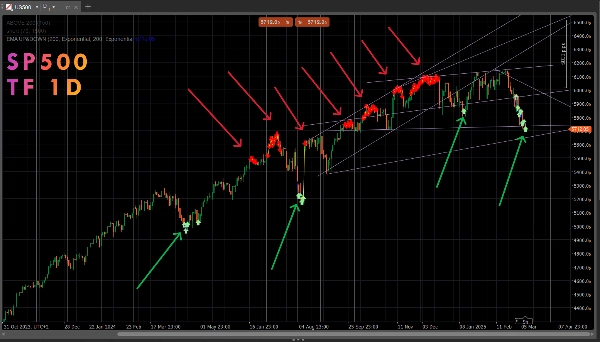
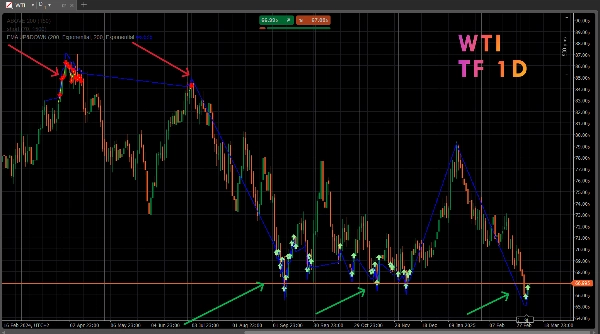
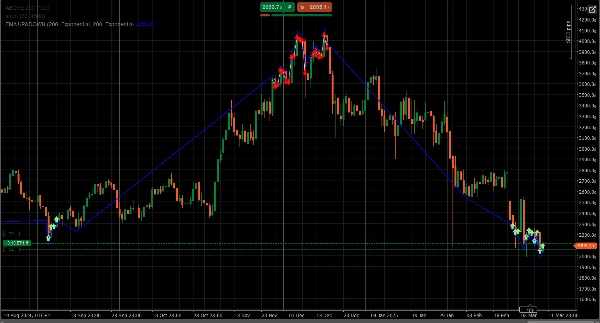
Il SectorIndex Dual Moving Average Indicator è uno strumento di trading eccezionale per chi cerca segnali accurati 🎯 e la capacità di capitalizzare sulle oscillazioni del mercato 📉📈. Questo indicatore sfrutta due medie mobili—una corta e una lunga—offrendo una combinazione di semplicità e potenza 💪 che si adatta a qualsiasi asset e timeframe.
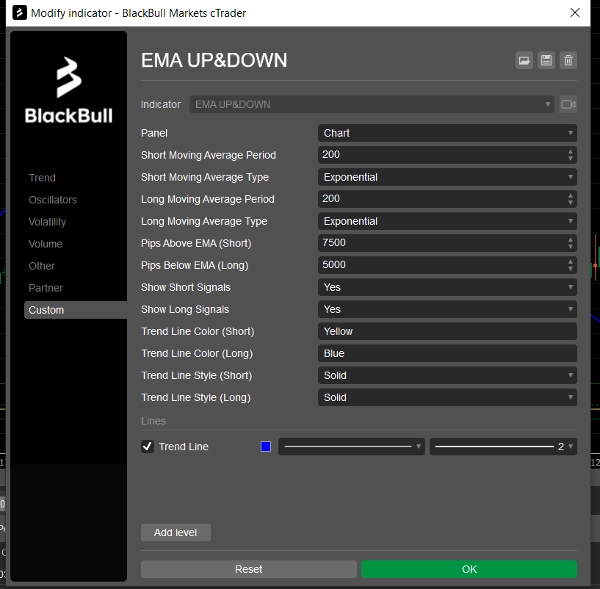
Con parametri configurabili per adattarsi a vari mercati e asset, puoi ottenere segnali precisi LONG e SHORT basati sulle condizioni di prezzo rispetto alle medie mobili. L'indicatore non si limita a tracciare linee, ma aggiunge linee di tendenza dinamiche 🔄, segnali visivi chiari (freccia verso il basso per short ⬇️, freccia verso l'alto per long ⬆️), e supporta personalizzazioni come colore 🎨 e stile della linea.
Questo indicatore non è solo uno strumento prezioso per i trader discrezionali, ma serve anche come fondamento tecnico per diversi bot di trading automatizzato, sviluppati e attualmente disponibili per la vendita in questo negozio. Grazie all'accuratezza e alla flessibilità del SectorIndex Dual MA Indicator, i bot costruiti su di esso offrono intuizioni eccezionali per il trading algoritmico, ottimizzati per vari asset e strategie.
🔥 Vantaggi:
- Adattabilità a tutti i timeframe e asset ⏱️.
- Segnali precisi e chiari con supporto visivo sul grafico 👀.
- Configurabilità completa: pips sopra/sotto la media, stile e colore ✨.
- Eccellente strumento per strategie di trend-following o contrarian 📊.
- Fondamento tecnico per lo sviluppo di bot automatizzati 🤖.
⚠️ Rischi: È fondamentale ricordare che il trading comporta rischi ⚠️. Nessun indicatore, per quanto potente, può garantire profitti 💸. Usa sempre una gestione del rischio appropriata 🛡️ e testa l'indicatore su un conto demo 🧪 prima di applicarlo con denaro reale.
Puoi acquistare il cBot progettato attorno a questo indicatore e ad altri due indicatori a questo link: https://ctrader.com/it/products/1056?u=Labot
Riepilogo
Designed for adaptability, it supports multiple markets including Forex, cryptocurrencies, commodities, indices, and stocks. It serves both discretionary traders seeking precise entry signals and developers as a technical foundation for automated trading bots. These bots leverage the indicator’s accuracy and flexibility for algorithmic strategies optimized across different assets.
Key features include compatibility with all timeframes and assets, clear visual signals on charts, and extensive customization options. The indicator is suitable for trend-following and contrarian strategies. Users are advised to apply appropriate risk management and test the indicator on demo accounts before live trading. Additional automated bots based on this indicator are available separately.
Recensioni dei clienti
5 | 100 % | |
4 | 0 % | |
3 | 0 % | |
2 | 0 % | |
1 | 0 % |


![Logo di "[Stellar Strategies] Market Session Ultimate"](https://cdn.ctrader.com/image/webp/61ffd537-0125-4246-9e72-42eca1791d64_28232)