Opis
Odblokuj precyzyjne handel dzięki naszej rewolucyjnej technologii śledzenia trendów
BrickAlgo TrendTracker to ostateczny wskaźnik identyfikacji trendów zaprojektowany specjalnie dla cTrader. To potężne narzędzie techniczne pomaga łatwo dostrzec kluczowe odwrócenia rynku, dostarczając wyraźne wizualne sygnały dla optymalnych punktów wejścia i wyjścia.
Kluczowe funkcje:
- Dynamiczne wykrywanie trendów: Identyfikuje zmiany trendu na podstawie analizy ruchu cen
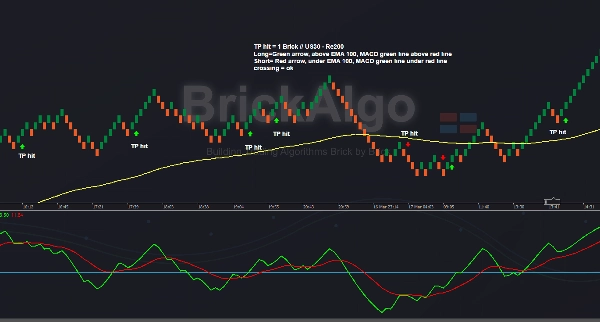
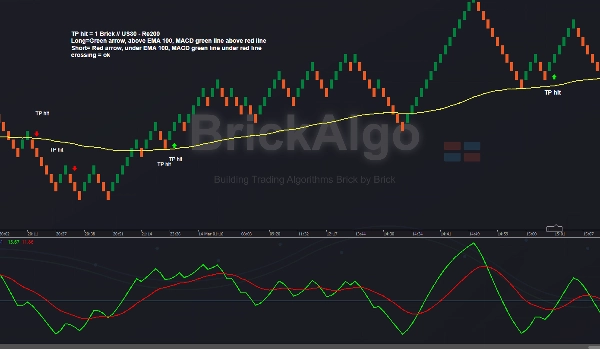
- System sygnałów wizualnych: Kolorowe strzałki pokazują zmiany trendu wzrostowego i spadkowego
- Śledzenie wyników: Opcjonalny wyświetlacz wartości pipsów pokazuje zysk/stratę między sygnałami
- Konfigurowalne ustawienia: Dostosuj parametry do swojego stylu handlu i ram czasowych
- Czysty interfejs wykresu: Projekt nakładki utrzymuje wykresy wolne od bałaganu
Jak to działa:
BrickAlgo TrendTracker analizuje ruchy cen, porównując bieżące wartości ze wygładzonymi średnimi cenami maksymalnymi i minimalnymi. Gdy wykryty zostanie istotny wzorzec zmiany, wskaźnik generuje sygnał, pomagając zidentyfikować potencjalne odwrócenia trendu zanim staną się one oczywiste dla innych traderów.
Oto zwięzłe wyjaśnienie, jak korzystać ze wskaźnika:
- Załaduj wskaźnik: Dodaj wskaźnik do swojego wykresu z menu wskaźników w cTrader.
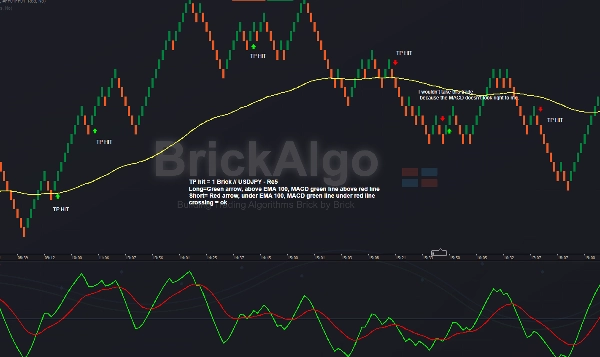
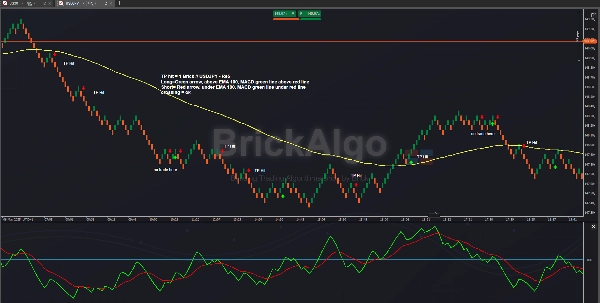
- Użyj wykresu Renko (np. Re5): Upewnij się, że korzystasz z wykresu Renko, takiego jak Re5, który jest tylko przykładem. Wskaźnik działa z różnymi rozmiarami cegiełek. Osobiście handluję USDJPY na Re5 oraz US30 na Re100 i Re200 z tym wskaźnikiem.
- Dostosuj ustawienia: Odnieś się do załączonych zrzutów ekranu, aby poznać zalecane ustawienia wskaźnika.
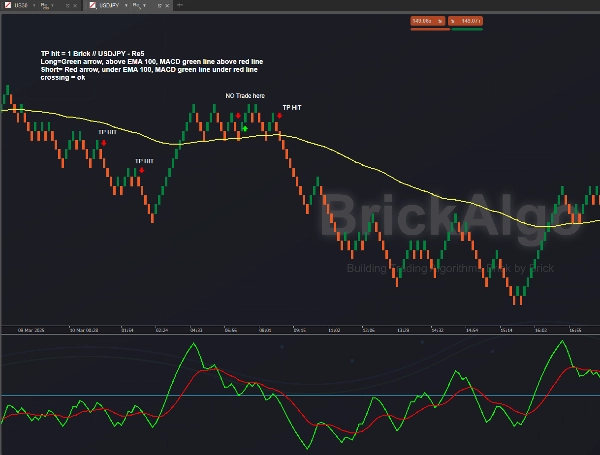
- Filtruj sygnały: Dla lepszego potwierdzenia transakcji używaj MACD, jak pokazano na zrzutach ekranu, potwierdzenia HTF, wsparcia i oporu, EMA lub innych wskaźników BrickAlgo, takich jak BrickAlgo TrendPulse.
- TP i SL: Używam 1 rozmiaru cegiełki dla Take Profit (TP), podczas gdy Stop Loss (SL) jest zmienny, zwykle między 1 a 3 cegiełkami.
Osobiście wolę handlować USDJPY na wykresie Re5 i używać 100 EMA i MACD, jak pokazano na zrzutach ekranu. Używam BrickAlgo TrendPulse do zawierania dodatkowych transakcji.