
Rsi + Volume
指标
707 下载
版本 1.0, Mar 2025
Windows 版、Mac 版
5.0
评价:3
说明
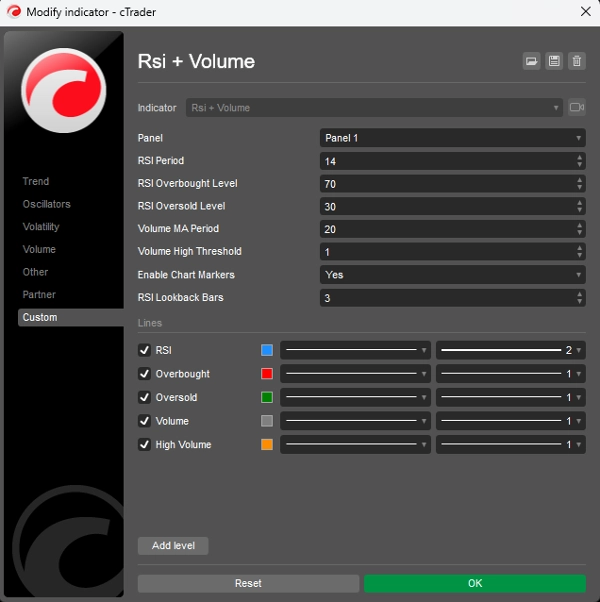
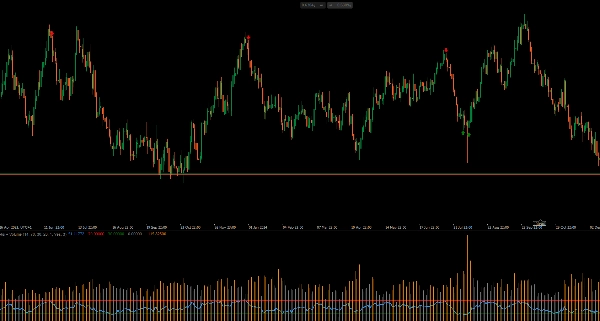
该指标结合了RSI(相对强弱指数)和成交量分析,以生成更可靠的交易信号。其原理是,显著的价格变动应伴随着高成交量,以确认该变动的力度。
关键组成部分:
- RSI分析:
-
- 衡量价格变动的速度和变化,范围为0-100
- 识别超买状态(高于70)和超卖状态(低于30)
- 帮助发现市场潜在的反转点
- 成交量分析:
-
- 将当前成交量与近期成交量的移动平均进行比较
- 突出显示高成交量时期(橙色柱状图)
- 确认价格变动背后的力度
- 信号生成:
-
- 买入信号:当RSI突破超卖水平(30)且伴随高成交量时
- 卖出信号:当RSI跌破超买水平(70)且伴随高成交量时
- 视觉信号直接显示在图表上(买入为绿色向上箭头,卖出为红色向下箭头)
使用方法:
- 当价格处于下跌趋势且RSI显示超卖状态时,寻找买入信号
- 当价格处于上涨趋势且RSI显示超买状态时,寻找卖出信号
- 较高的成交量确认信号的力度
- 调整参数(RSI周期、成交量阈值)以匹配您的交易时间框架
该指标通过要求RSI确认和高于平均水平的成交量来过滤虚假信号,使其比单独使用RSI更可靠。
摘要
AI 摘要
The "Rsi + Volume" indicator integrates the Relative Strength Index (RSI) with volume analysis to enhance the reliability of trading signals. It operates on the principle that significant price movements should be confirmed by high trading volume.
Key components include:
1. RSI Analysis:
- Measures the speed and change of price movements on a 0-100 scale.
- Identifies overbought conditions (above 70) and oversold conditions (below 30).
- Helps detect potential market reversal points.
2. Volume Analysis:
- Compares current volume against a moving average of recent volume.
- Highlights periods of high volume using orange histogram bars.
- Confirms the strength behind price movements.
Signal generation occurs when RSI crosses key thresholds with accompanying high volume:
- Buy signals trigger when RSI rises above the oversold level (30) with high volume.
- Sell signals trigger when RSI falls below the overbought level (70) with high volume.
Visual signals appear directly on the chart as green up arrows for buys and red down arrows for sells.
Users can adjust parameters such as RSI period and volume threshold to fit their trading timeframe. This indicator aims to filter out false signals by requiring both RSI confirmation and above-average volume, providing more dependable trade signals than RSI alone.
指标配置
客户评价
5.0
评价:3
5 | 100 % | |
4 | 0 % | |
3 | 0 % | |
2 | 0 % | |
1 | 0 % |
客户评价
October 12, 2025
Hello, the RSI +volume indicator is perfect, but it needed to have something: when the little arrow appears on the chart, it could show a notification or an alarm. Would you be able to add that alarm or notification in cTrader?
August 12, 2025
Pros: Combines RSI and volume for stronger trading signals. Works well when RSI threshold intersects with high volume spikes. Lightweight and clear visuals. Cons: No alerts or tooltips. Lacks template saving. May generate noise on low-volume timeframes without additional filters.
讨论
常见问答
Signal
Indices
RSI
cTrader Store 提供的所有产品,包括交易机器人、指标和插件,均由第三方开发者提供,仅供信息参考和技术访问之用。cTrader Store 并非经纪商,不提供投资建议、个人推荐或任何未来业绩保证。


价格
注册日期 21/02/2025
466.3M
交易量
180.83K
盈利点数
22
销售
6.89K
免费安装