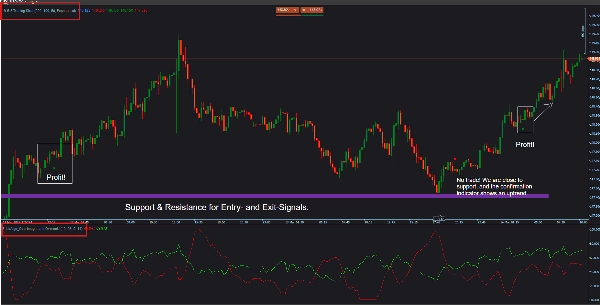
"9-5-3 Trading Strat" 标识
9-5-3 Trading Strat
5.0
评价:1
"9-5-3 Trading Strat" 已上传图片
注册日期 21/02/2025
461.42M
交易量
178.3K
盈利点数
10
销售
5.76K
免费安装

### For optimal trade confirmations, also use my free indicators, such as BrickAlgo_Overbought and Oversold. (1st Screenshot) ###

### Adjust the settings to match your trading style. Use small MAs for scalping in M1-M5 or larger MAs for M15 scalps, swing trading, etc. ###

The Larry Williams 9-5-3 Indicator brings the proven Moving Average strategy to the next level. This indicator precisely identifies buy and sell signals based on three exponential moving averages (MAs), helping you spot trends early and make informed trading decisions.

Key Features:
✔️ Three customizable MAs (9, 5, and 3 periods) for optimal trend analysis
✔️ Clear buy & sell signals to execute trades with confidence
✔️ Intuitive color coding – easy visualization of market movements
✔️ 100% compatible with cTrader – simple setup, no hassle

📈 How Does It Work?
👉 Buy Signal: MA(3) is above MA(5), and MA(5) is above MA(9) – a strong bullish trend!
👉 Sell Signal: MA(3) is below MA(5), and MA(5) is below MA(9) – a strong bearish trend!

🎯 Who Is This Indicator For?
Whether you're a day trader, swing trader, or long-term investor, the Larry Williams 9-5-3 Indicator helps you make smarter trading decisions!

💾 Download Now & Improve Your Trading Results!

📌 Available on the official cTrader website!

👉 Gain the Edge in Trading Today! 🔥

Indicator profile
5.0
评价:1
5
100 %
4
0 %
3
0 %
2
0 %
1
0 %
客户评价
August 12, 2025
Pros: Clear entry/exit signals, lightweight, customizable. Cons: No trend panel, no alerts, possible false signals in sideways markets.
Signal
Scalping
Products available through cTrader Store, including trading bots, indicators and plugins, are provided by third-party developers and made available for informational and technical access purposes only. cTrader Store is not a broker and does not provide investment advice, personal recommendations or any guarantee of future performance.

该作者的其他作品

High-probability trading signals in the fast-paced world of forex and CFD trading.
High-Performance Renko Chart Indicator with Advanced filtering method.
"Rsi + Volume" 标识
5.0
(2)
免费
This indicator combines RSI (Relative Strength Index) with volume analysis to generate more reliable trading signals.
Automatic Elliott Wave Detection with Professional Filters
The Renko Moving Average Cross indicator combines classic EMA crossover signals with Renko-filtered prices.
Engulfing Pattern Indicator
MA-RSI HTF Confirmation: Eliminate false signals and trade with confidence!
🚀 Simplify Your Trading Decisions With Powerful Technical Analysis.
PinBarCandlestickPattern Indicator
Hammer Pattern Indicator
Breakout Multi-Timeframe Strategy Indicator
"ADX and ADI" 标识
5.0
(2)
免费
This custom indicator is a complete implementation of the Average Directional Index and Directional Indicators.

猜您喜欢

Heikin Ashi (Heiken Ashi) - This indicator displays HeikinAshi candles.
Innovative indicator that highlights trend direction and momentum strength quickly and clearly on Forex charts.
Rolling Z-Score Trend Heat — See the Market's Temperature in Real Time
This indicator is a powerful visualization tool 💡. Its design is flexible, robust, and solves a core problem for multi-
28-method MA library in one indicator — from classic EMAs to adaptive & zero-lag variants.
Taiz Pro Volume Profile مؤشر احترافي لتحليل الحجم (Volume Profile) يكشف عن مناطق الدعم والمقاومة الحقيقية التي يركز عليه
Indicatore dei livelli numeri tondi sul grafico , regolabile.Indicator of levels round numbers on the graph, adjustable
ICT Breakers (BOS/MSS) - Professional market structure and breakout detection tool.
Session Volatility Radar: adaptive volatility+structure signals with session bands, IB ranges and SignalFib
Cumulative delta candles + volume profile
Laguerre RSI is based on John EHLERS' Laguerre Filter to avoid the noise of RSI.
The Candlestick Patterns Dashboard. Detects 30+ patterns with Strength %, Trend Filters, Alerts & Win Rate Stats. 📉📈
It calculates Anchored VWAP and StdDev bands from a user-defined start date for cTrader charts.
Scalpers Volume Profile
Designed to identify and visualize price reversal patterns using Bézier curves.
The Break of Structure (BoSCHoCh) Indicator is a smart market structure tool designed to help traders easily spot trend.
Multi-anchor VWAP indicator for cTrader. Plots two VWAP lines (red and blue) with selectable anchors.
KAMA Keltner – Adaptive Volatility Channel for Precision Trading
注册日期 21/02/2025
461.42M
交易量
178.3K
盈利点数
10
销售
5.76K
免费安装