Descripción
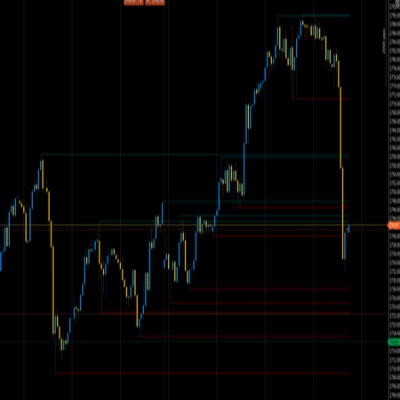
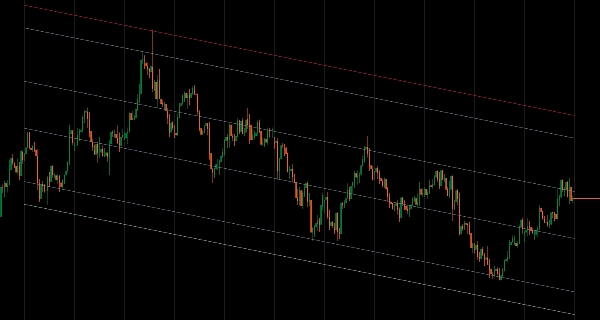
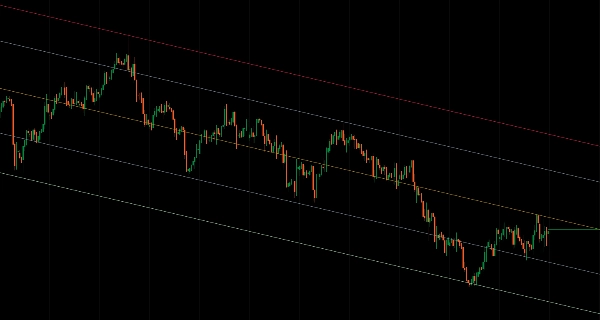
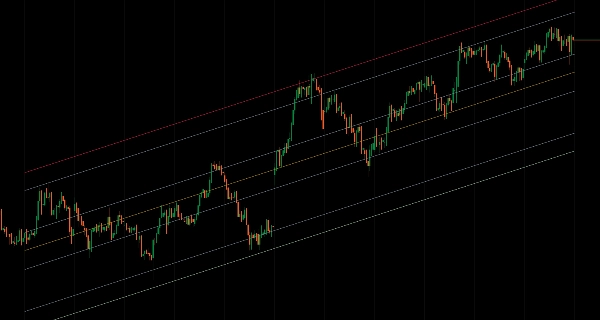
Canales de precios estadísticos con modos de cálculo flexibles y representación de bandas basada en desviaciones.
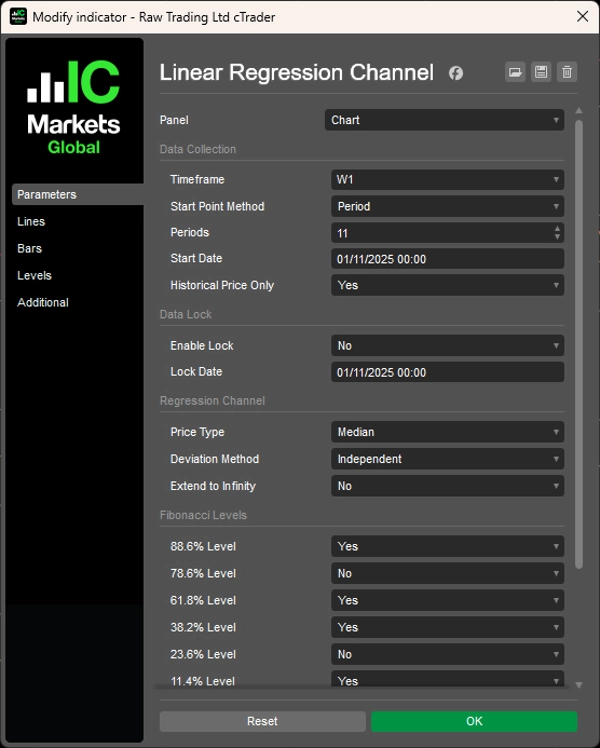
Ajusta líneas de regresión a través de datos de precios usando el Modo Período (últimas N barras), Modo Fecha y Hora (desde fechas específicas) o Mecanismo de Bloqueo para congelar el análisis en puntos históricos mientras el precio continúa.
Tres métodos de desviación (Promedio, Independiente, Máximo) para canales simétricos y asimétricos, seis niveles de retroceso de Fibonacci (11.4% a 88.6%), análisis multitemporal, seis tipos de precio (Apertura/Alto/Bajo/Cierre/Medio/Típico), modo solo histórico para pruebas retrospectivas estables y proyección extendida al infinito ofrecen un análisis de regresión completo para traders que buscan zonas de reversión a la media y límites estadísticos de precio en diversas condiciones de mercado.
CARACTERÍSTICAS
Selección de Datos Flexible
- Modo Período: Analiza las últimas N barras (por ejemplo, las últimas 12 velas mensuales)
- Modo Fecha y Hora: Comienza desde eventos o fechas específicas del mercado
- Mecanismo de Bloqueo: Congela el análisis en un punto histórico mientras el precio continúa
- Multitemporal: Dibuja regresión desde cualquier marco temporal en tu gráfico actual
Métodos Inteligentes de Desviación
- Promedio: Niveles equilibrados usando desviaciones medias—ideal para zonas de trading
- Independiente: Canales asimétricos que se adaptan a la volatilidad direccional
- Máximo: Muestra límites extremos de precio para análisis de rango completo
Herramientas Profesionales de Análisis
- 6 niveles de retroceso de Fibonacci (11.4%, 23.6%, 38.2%, 61.8%, 78.6%, 88.6%)
- 6 tipos de precio: Apertura, Alto, Bajo, Cierre, Medio, Típico
- Modo solo histórico: Excluye barras en formación para pruebas retrospectivas estables
- Opción de extender al infinito para proyecciones a largo plazo
Personalización Completa
- Personalización completa de colores para todos los elementos del canal
- Control independiente sobre la línea de regresión y las bandas de desviación
- Presentación visual limpia para un análisis enfocado
Capacidades Avanzadas
- Función de bloqueo para estudios de análisis basados en eventos
- Combina estructura de marco temporal superior con ejecución en marco temporal inferior
- Opciones de canal simétrico y asimétrico para diferentes condiciones de mercado
__________________________________________________________________________________________
MÁS INDICADORES GRATUITOS
Explora una amplia gama de herramientas de análisis de mercado—desde estructura y volumen hasta regresión, volatilidad y marcos temporales personalizados.
El código fuente está disponible en el repositorio de GitHub repository.
Todos son gratuitos para usar. Pero si deseas apoyar con un café, puedes hacerlo aquí.
Soporte/Resistencia
Volumen
- Perfilador de Actividad de Volumen
- Analizador de Eficiencia de Volumen
- Análisis de Perfil de Volumen
- Perfil de Volumen - Actualizado
- Análisis de Dispersión de Volumen
- VWAP (Precio Promedio Ponderado por Volumen)
Medias Móviles
- Canal SSL
- Media Móvil Anclada
- Media Móvil Escalada por Desviación
- Activador Gann Alto Bajo
- Línea de Tendencia Instantánea
- Media Móvil Adaptativa Kaufman con Visión de Tendencia
- Canal de Media Móvil
- Suite de Medias Móviles
- Media Móvil de Canal de Tendencia
Utilidades/Personalizado
Basado en Regresión
Volatilidad
Osciladores
__________________________________________________________________________________________
AVISO LEGAL
El trading implica riesgos. Este indicador está destinado solo para análisis técnico — siempre aplica una gestión de riesgos adecuada y opera con responsabilidad.
COMENTARIOS Y MEJORAS
Si tienes sugerencias, solicitudes de funciones o ideas para mejoras, por favor deja un comentario en la pestaña de Discusión. Tus comentarios ayudan a mejorar el indicador para todos.
Resumen
Valoraciones de clientes
5 | 100 % | |
4 | 0 % | |
3 | 0 % | |
2 | 0 % | |
1 | 0 % |