
Descripción
VISIÓN GENERAL
La Línea de Tendencia Instantánea es un indicador técnico desarrollado por John Ehlers, un ingeniero eléctrico que aplicó principios de procesamiento digital de señales (DSP) al análisis del mercado financiero. Originalmente publicado en la revista Stocks & Commodities (febrero de 2002) y detallado en sus libros "Rocket Science for Traders" y "Cybernetic Analysis for Stocks and Futures", este indicador aísla el componente de tendencia de los datos de precios filtrando los componentes cíclicos (oscilatorios).
CONCEPTO
A diferencia de los promedios móviles tradicionales que simplemente suavizan los datos de precios, la Línea de Tendencia Instantánea utiliza técnicas matemáticas derivadas de la ingeniería eléctrica para descomponer la acción del precio en dos componentes distintos:
- Componente de Tendencia - La inclinación direccional del mercado
- Componente Cíclico - Las fluctuaciones oscilantes alrededor de la tendencia
Al aplicar filtros notch y la metodología de la Transformada de Hilbert, Ehlers creó un indicador que responde rápidamente a cambios genuinos de tendencia mientras filtra el ruido y los ciclos a corto plazo. El resultado es una línea de tendencia que se adapta a las condiciones del mercado con un retraso significativamente reducido en comparación con los promedios móviles simples o exponenciales de períodos similares.
La ventaja principal de este enfoque es la precisión matemática para separar lo que es "tendencia" de lo que es "ruido cíclico", en lugar de simplemente promediar el precio durante un período fijo de retroceso.
CÓMO FUNCIONA
El indicador calcula una línea de tendencia suavizada usando una fórmula recursiva basada en el parámetro Alpha. La fórmula incorpora:
- Datos de precio actuales y recientes (punto medio HL/2)
- Valores previos de la línea de tendencia
- Coeficiente de suavizado Alpha (por defecto 0.07)
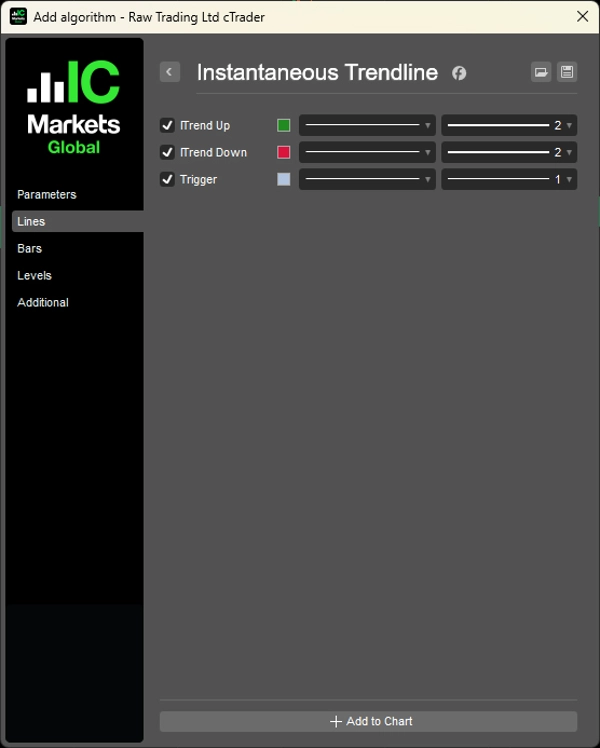
El indicador también genera una línea de Disparo, que es la Línea de Tendencia Instantánea desplazada por 2 barras. Esta línea de disparo se usa para generar señales de trading mediante lógica de cruces.
INTERPRETACIÓN
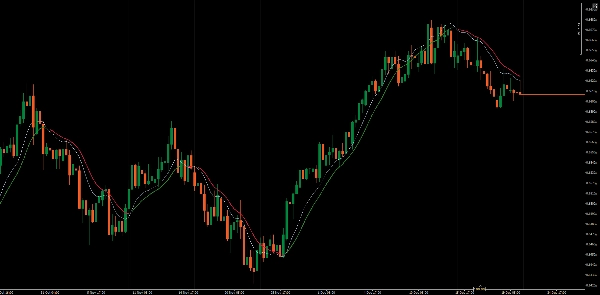
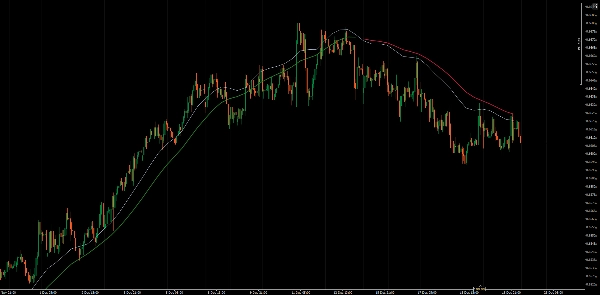
El indicador traza tres líneas:
- ITrend Alcista: Se muestra cuando Disparo > ITrend, indicando condiciones alcistas
- ITrend Bajista: Se muestra cuando Disparo < ITrend, indicando condiciones bajistas
- Disparo: La versión retrasada 2 barras de la línea de tendencia
Generación de Señales:
- Señal Alcista: Cuando la línea de Disparo cruza por encima de la Línea de Tendencia Instantánea
- Señal Bajista: Cuando la línea de Disparo cruza por debajo de la Línea de Tendencia Instantánea
La visualización codificada por colores facilita la identificación de la dirección actual de la tendencia de un vistazo.
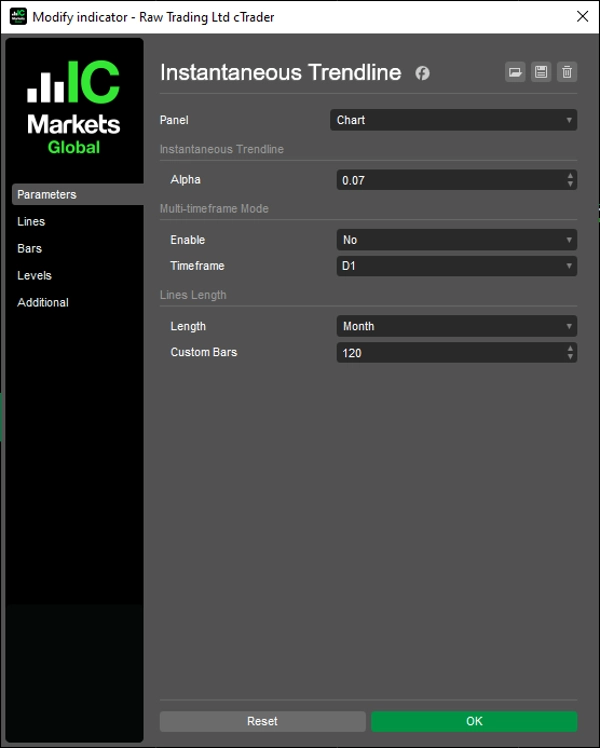
PARÁMETROS CLAVE
Alpha (0.01 - 1.0, por defecto 0.07)
Controla el suavizado y la capacidad de respuesta de la línea de tendencia. Valores más bajos producen líneas de tendencia más suaves y de respuesta más lenta, adecuadas para tendencias a largo plazo. Valores más altos aumentan la sensibilidad a los cambios de precio pero pueden generar más señales falsas en mercados volátiles. El valor por defecto de 0.07 equilibra la capacidad de respuesta con el filtrado de ruido.
Longitud de Líneas (por defecto 120)
Determina cuántas barras de datos históricos de la línea de tendencia se muestran en el gráfico. Esto ayuda a mantener el gráfico limpio mientras se mantiene suficiente contexto.
LIMITACIONES
- Como todas las herramientas de seguimiento de tendencias, la Línea de Tendencia Instantánea puede producir señales falsas en mercados laterales o sin tendencia definida
- Durante tendencias fuertes, el indicador puede mantenerlo en la tendencia por más tiempo, pero puede perder el punto exacto de máximo o mínimo
- El rendimiento varía significativamente según las condiciones del mercado (tendencia vs. lateralidad)
- El indicador es reactivo, no predictivo - identifica tendencias después de que han comenzado
__________________________________________________________________________________________
MÁS INDICADORES GRATUITOS
Explore una amplia gama de herramientas de análisis de mercado—desde estructura y volumen hasta regresión, volatilidad y marcos temporales personalizados.
El código fuente está disponible en el repositorio de GitHub repository.
Todos son gratuitos para usar. Pero si desea apoyar con un café, puede hacerlo aquí.
Soporte/Resistencia
Volumen
- Perfilador de Actividad de Volumen
- Analizador de Eficiencia de Volumen
- Análisis de Perfil de Volumen
- Perfil de Volumen - Actualizado
- Análisis de Dispersión de Volumen
- VWAP (Precio Promedio Ponderado por Volumen)
Promedios Móviles
- Canal SSL
- Promedio Móvil Anclado
- Promedio Móvil Escalado por Desviación
- Activador Gann High Low
- Línea de Tendencia Instantánea
- MA Adaptativo Kaufman con Visión de Tendencia
- Canal de Promedio Móvil
- Suite de Promedios Móviles
- Promedio Móvil de Canal de Tendencia
Utilidades/Personalizados
Basado en Regresión
Volatilidad
Osciladores
__________________________________________________________________________________________
DESCARGO DE RESPONSABILIDAD
El trading implica riesgos. Este indicador está destinado únicamente para análisis técnico — siempre aplique una gestión adecuada del riesgo y opere con responsabilidad.
RETROALIMENTACIÓN Y MEJORAS
Si tiene sugerencias, solicitudes de funciones o ideas para mejoras, por favor deje un comentario en la pestaña de Discusión. Su retroalimentación ayuda a mejorar el indicador para todos.
Resumen
Valoraciones de clientes
5 | 100 % | |
4 | 0 % | |
3 | 0 % | |
2 | 0 % | |
1 | 0 % |


![Logotipo de "[Stellar Strategies] MARSI Signal Plotter"](https://cdn.ctrader.com/image/webp/7b2b8da6-8f8e-4646-8d4a-4710c516c01e_25567)


