Descripción
Calcule niveles de soporte y resistencia utilizando cinco métodos profesionales de pivote en cualquier marco temporal.
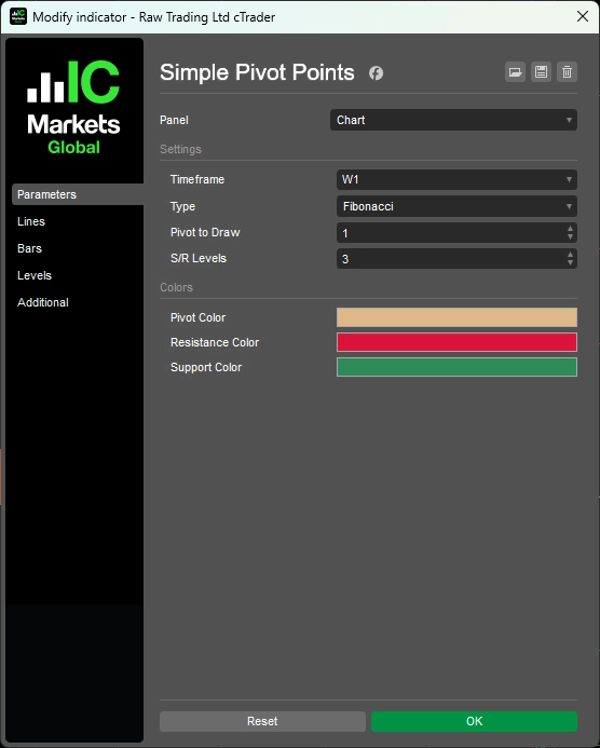
Genera automáticamente niveles de pivote (Estándar, Fibonacci, Woodie, Camarilla, DeMark) desde datos M5 hasta Mensuales con visualización limitada en el tiempo para cada período.
Cinco algoritmos de cálculo con lógica distinta de espaciamiento S/R, niveles configurables de soporte/resistencia (0-6 por lado), visualización histórica de pivotes para múltiples períodos anteriores, líneas con etiquetas automáticas (PP, R1-R6, S1-S6) y visualización codificada por colores que ofrecen un análisis de pivote de nivel institucional para traders que buscan niveles clave de precio y reversiones intradía.
CARACTERÍSTICAS
Cinco Métodos de Cálculo
- Estándar: Fórmula clásica de trader de piso—los pivotes más observados a nivel mundial
- Fibonacci: Usa ratios Fib (38.2%, 61.8%, 100%, 138.2%, 161.8%) para el espaciamiento S/R
- Woodie: Da más peso al precio de cierre—más reactivo a la acción reciente del precio
- Camarilla: Niveles intradía ajustados usando multiplicadores 1.1/12—popular para scalping
- DeMark: Fórmula condicional basada en la relación cierre vs. apertura—solo 1 nivel S/R pero muy respetado
Personalización Completa
- Cualquier marco temporal: Calcule desde datos M5, H1, H4, Diario, Semanal, Mensual
- Pivotes históricos: Muestre hasta múltiples períodos anteriores (por ejemplo, las últimas 3 semanas de pivotes)
- Niveles configurables: Mostrar 0-6 niveles de soporte/resistencia por lado
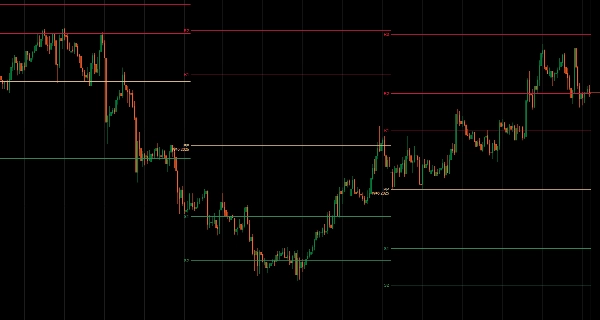
- Líneas con etiquetas automáticas: PP, R1-R6, S1-S6 claramente marcadas
- Líneas limitadas en el tiempo: Los pivotes de cada período se muestran solo durante la duración de ese período
- Codificado por colores: Pivote (beige), Resistencia (rojo), Soporte (verde)
__________________________________________________________________________________________
MÁS INDICADORES GRATUITOS
Explore una amplia gama de herramientas de análisis de mercado—desde estructura y volumen hasta regresión, volatilidad y marcos temporales personalizados.
El código fuente está disponible en el repositorio de GitHub.
Todos son gratuitos para usar. Pero si desea apoyar con un café, puede hacerlo aquí.
Soporte/Resistencia
Volumen
- Perfilador de Actividad de Volumen
- Analizador de Eficiencia de Volumen
- Análisis de Perfil de Volumen
- Perfil de Volumen - Actualizado
- Análisis de Dispersión de Volumen
- VWAP (Precio Promedio Ponderado por Volumen)
Medias Móviles
- Canal SSL
- Media Móvil Anclada
- Media Móvil Escalada por Desviación
- Activador Gann High Low
- Línea de Tendencia Instantánea
- Media Móvil Adaptativa Kaufman con Visión de Tendencia
- Canal de Media Móvil
- Suite de Medias Móviles
- Media Móvil de Canal de Tendencia
Utilidades/Personalizados
Basado en Regresión
Volatilidad
Osciladores
__________________________________________________________________________________________
DESCARGO DE RESPONSABILIDAD
El trading implica riesgos. Este indicador está destinado solo para análisis técnico — siempre aplique una gestión adecuada del riesgo y opere con responsabilidad.
COMENTARIOS Y MEJORAS
Si tiene sugerencias, solicitudes de funciones o ideas para mejoras, por favor deje un comentario en la pestaña de Discusión. Sus comentarios ayudan a mejorar el indicador para todos.
Resumen
Valoraciones de clientes
5 | 100 % | |
4 | 0 % | |
3 | 0 % | |
2 | 0 % | |
1 | 0 % |