Описание
ВАЖНЫЕ ЗАМЕТКИ - ЧИТАЙТЕ СНАЧАЛА
Объем на Форекс не является реальным объемом
Объем на форекс — это тиковый объем — он считает, сколько раз изменялась цена. Он НЕ учитывает, сколько денег было обменяно.
Что тиковый объем не может показать
- Размер сделки. Сделка на 100 долларов и сделка на 10 000 000 долларов считаются как 1 тик.
- Реальный денежный поток. Вы не можете увидеть, двинули ли цену крупные или мелкие деньги.
- Истинную ликвидность. Вы не видите, сколько ордеров ожидает на рынке.
- Активность банков. Банки видят данные реального объема. Вы — нет.
Что это значит
Тиковый объем показывает только, как часто менялась цена — а не деньги за ней. Это создает проблемы:
- Вы не можете отслеживать банки или учреждения. Они используют данные реального объема, к которым у вас нет доступа.
- Вы не можете подтвердить теории «умных денег». Для этих идей нужен реальный объем, а не подсчет тиков.
- Вы не можете оценить истинную ликвидность. Активность тиков не показывает глубину ордеров или реальную силу рынка.
- Вы не можете измерить реальную покупательскую или продажную силу. Многие мелкие сделки выглядят так же, как одна крупная институциональная сделка.
- Всплески объема могут быть обманчивыми. Всплеск может быть просто алгоритмическим шумом, а не реальным торговым интересом.
Как правильно использовать этот индикатор
- Рассматривайте его как измеритель активности, а не денег. Высокий тиковый объем = рынок занят. Низкий тиковый объем = рынок спокоен. Ничего больше.
- Сравнивайте активность в разное время. Используйте его, чтобы увидеть: сессия Лондона активнее Нью-Йорка? Сегодня активнее вчера? Период тренда активнее консолидации?
- Комбинируйте с ценовой структурой. Используйте уровни поддержки/сопротивления, точки разворота или BOS/ChoCH вместе с объемом. Контекст цены предотвращает ложные сигналы от шумных всплесков объема.
- Следите за активностью на важных ценовых уровнях. Когда цена тестирует ключевой уровень и тиковый объем растет, это значит, что больше трейдеров активны. Это НЕ значит, что задействованы крупные игроки.
- Не думайте, что он показывает институциональную активность. Тиковый объем не показывает накопление, крупные ордера или «умные деньги». Используйте его только для измерения ритма и темпа.
__________________________________________________________________________________________
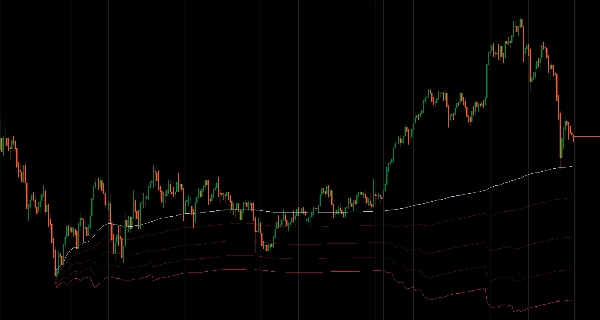
Средневзвешенная цена по объему с гибкими периодами сброса и тремя методами расчета полос.
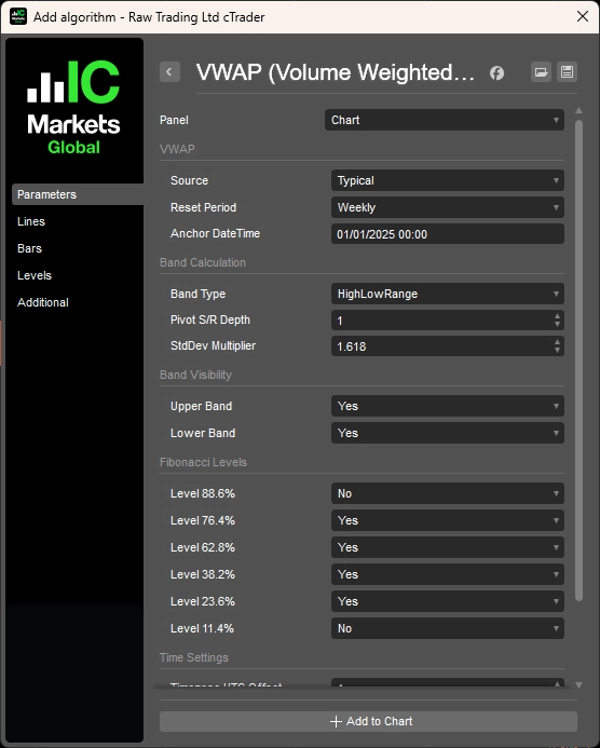
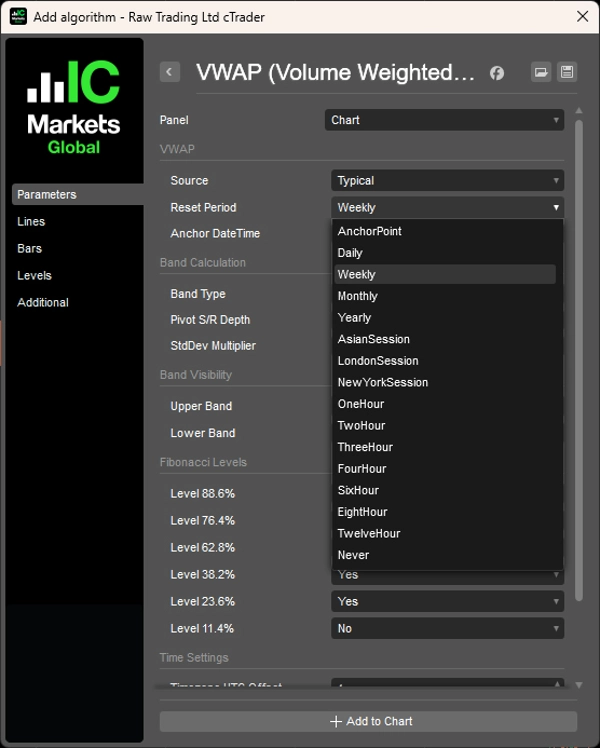
Вычисляет средневзвешенную цену по объему с гибкими периодами сброса, включая интервалы на основе времени (дневные, недельные, месячные, годовые или пользовательские почасовые), сбросы по сессиям (Азиатская, Лондонская, Нью-Йоркская с настраиваемыми временами начала), режим якорной точки для закрепления VWAP на конкретных событиях или скользящий расчет по всем доступным данным.
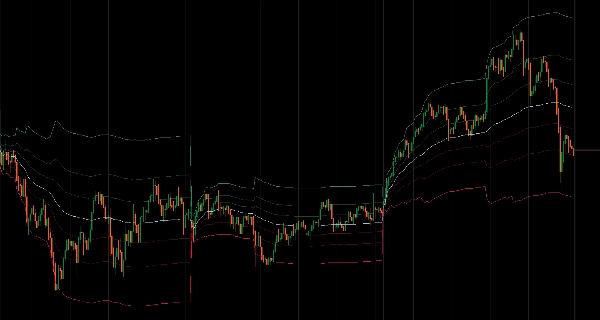
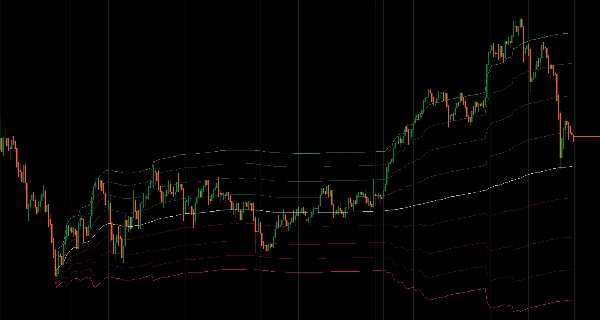
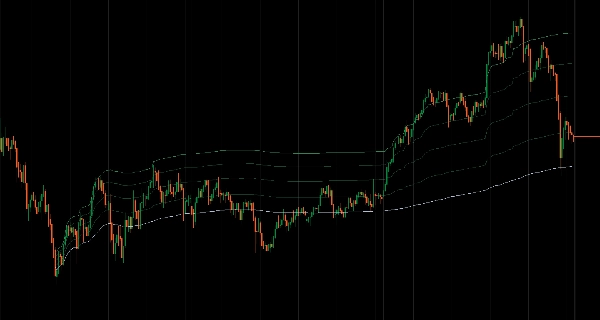
Предлагает три метода расчета полос: диапазон High/Low на основе ценового диапазона предыдущего периода, Фибоначчи Pivot с классическими расчетами точек поворота и полосы стандартного отклонения, которые расширяются и сжимаются в зависимости от волатильности.
Вы можете настроить восемь уровней Фибоначчи (100%, 88.6%, 76.4%, 62.8%, 50%, 38.2%, 23.6%, 11.4%, 0%) с индивидуальными переключателями видимости и быстрыми групповыми контролями верхних/нижних полос. Управление сессиями включает точную настройку времени начала с корректировкой UTC и обработку сброса с учетом часового пояса.
ОСОБЕННОСТИ
- Гибкие периоды сброса
-
- На основе времени: дневные, недельные, месячные, годовые или пользовательские почасовые интервалы (1H, 2H, 3H, 4H, 6H, 8H, 12H)
- На основе сессий: Азиатская, Лондонская, Нью-Йоркская сессии с настраиваемыми временами начала и смещениями часового пояса
- Якорная точка: закрепление VWAP на любой конкретной дате и времени для анализа событий
- Скользящий: расчет по всем доступным данным без сброса
- Три метода расчета полос
-
- Диапазон High/Low: полосы на основе ценового диапазона предыдущего периода
- Фибоначчи Pivot: классический расчет точек поворота по H/L/C предыдущего периода
- Стандартное отклонение: традиционные статистические полосы, расширяющиеся и сжимающиеся с волатильностью
- Полный контроль уровней Фибоначчи
-
- 8 настраиваемых уровней: 100%, 88.6%, 76.4%, 62.8%, 50% (VWAP), 38.2%, 23.6%, 11.4%, 0%
- Индивидуальные переключатели видимости уровней
- Групповые контролы верхних/нижних полос для быстрой настройки
- Управление сессиями
-
- Настройка точного времени начала сессии с корректировкой UTC (-12 до +14 часов)
- Визуальное отображение информации о сессии с текущим графиком сброса
- Обработка сброса по часам с учетом часового пояса
- Оптимизация производительности
-
- Ленивая калькуляция — полосы вычисляются только при видимости
- Интеллектуальное кэширование и пакетная обработка
- Минимальное влияние на ЦПУ даже при включенных всех уровнях
__________________________________________________________________________________________
БОЛЬШЕ БЕСПЛАТНЫХ ИНДИКАТОРОВ
Изучайте широкий спектр инструментов анализа рынка — от структуры и объема до регрессии, волатильности и пользовательских таймфреймов.
Исходный код доступен в репозитории на GitHub repository.
Все бесплатно для использования. Но если хотите поддержать кофе, можете отправить поддержку здесь.
Поддержка/Сопротивление
Объем
- Volume Activity Profiler
- Volume Efficiency Analyzer
- Volume Profile Analytics
- Volume Profile - Updated
- Volume Spread Analysis
- VWAP (Volume Weighted Average Price)
Скользящие средние
- SSL Channel
- Anchored Moving Average
- Deviation-Scaled Moving Average
- Gann High Low Activator
- Instantaneous Trendline
- Kaufman Adaptive MA with Trend Vision
- Moving Average Channel
- Moving Averages Suite
- Trend Channel Moving Average
Утилиты/Пользовательские
На основе регрессии
Волатильность
Осцилляторы
__________________________________________________________________________________________
ОТКАЗ ОТ ОТВЕТСТВЕННОСТИ
Торговля связана с риском. Этот индикатор предназначен только для технического анализа — всегда применяйте надлежащее управление рисками и торгуйте ответственно.
ОБРАТНАЯ СВЯЗЬ И УЛУЧШЕНИЯ
Если у вас есть предложения, запросы функций или идеи для улучшения, пожалуйста, оставьте комментарий во вкладке Обсуждение. Ваш отзыв помогает улучшить индикатор для всех.
Сводка
The indicator offers three band calculation methods: High/Low Range bands based on the previous period's price range, Fibonacci Pivot bands using classical pivot calculations, and Standard Deviation bands that adjust with market volatility. Users can customize eight Fibonacci levels (ranging from 0% to 100%) with individual visibility toggles and group controls for upper and lower bands.
Session management features include precise start time configuration with UTC offset adjustments and timezone-aware hourly resets, along with visual session information display. Performance optimizations include lazy calculation of bands only when visible, intelligent caching, and batch processing to minimize CPU usage.
Note: For forex markets, volume data represents tick volume (price change counts) rather than actual traded volume, so this indicator should be used as a measure of market activity rather than real money flow. It is intended for technical analysis with proper risk management.
Отзывы покупателей
5 | 100 % | |
4 | 0 % | |
3 | 0 % | |
2 | 0 % | |
1 | 0 % |