설명
커널 가중 회귀 수학을 이용한 적응형 추세 분석.
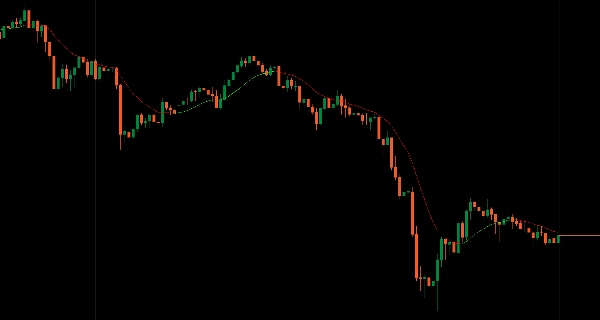
근처 바가 더 큰 영향을 미치고 먼 바는 지수적으로 희미해지는 가우시안 커널 가중치를 적용하여 고정 기간 지연 없이 매우 부드러운 추세선을 만듭니다.
지역 가격 구조에 자동으로 조정되며, 전통적인 이동 평균에 비해 지연이 최소화되고, 동적 색상 코딩(라임 상승 추세, 빨간색 하락 추세), 반응성 조정을 위한 대역폭 조절, 유연한 조회 창(50-2000 바), 그리고 임의 기간 선택 없이 적응형 평활화를 원하는 트레이더를 위한 수학적으로 정밀한 추세 식별을 제공하는 이색 무잡음 디자인을 갖추고 있습니다.
특징
커널 가중 계산
- 근처 바가 더 큰 영향을 미치고 먼 바는 지수적으로 희미해짐—임의의 고정 기간 없음
- 수학적으로 최적의 평활화를 위한 가우시안 커널 가중치
- 수동 재조정 없이 지역 가격 구조에 자동으로 적응
- 최소 지연: 동등한 이동 평균보다 실제 추세 변화에 더 빠르게 반응
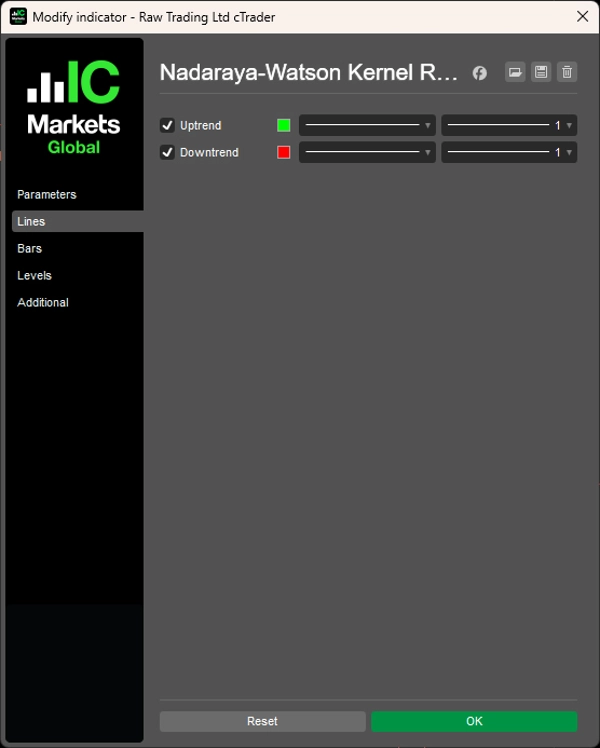
동적 색상 코딩
- 라임: 상승 추세
- 빨간색: 하락 추세
- 추세 방향의 즉각적인 시각적 확인
- 불연속선 표시: 색상 변화가 즉각적이고 시각적으로 명확함
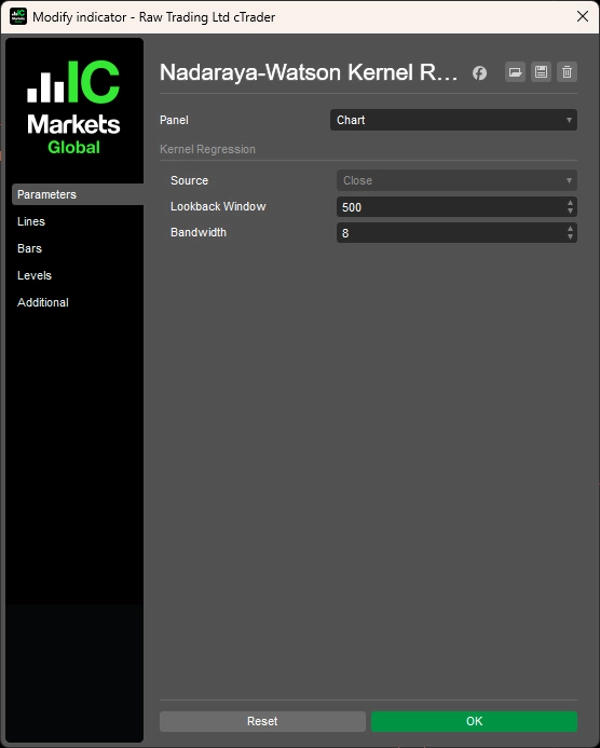
조절 가능한 매개변수
- 대역폭: 반응성 대 부드러움 미세 조정
- 유연한 조회 창: 시간 프레임에 맞게 50-2000 바 조정 가능
- 다양한 시장 조건과 거래 스타일에 적응
깔끔한 디자인
- 두 가지 색상, 잡음 없음—상승 추세 또는 하락 추세 중 하나
- 무잡음 추세 식별
- 복잡한 설정 불필요
- 수학적 정밀성을 갖춘 시각적 단순성
__________________________________________________________________________________________
더 많은 무료 지표
구조와 거래량부터 회귀, 변동성, 맞춤 시간 프레임에 이르기까지 다양한 시장 분석 도구를 탐색하세요.
소스 코드는 GitHub 저장소에서 확인할 수 있습니다.
모두 무료로 사용할 수 있습니다. 하지만 커피 지원을 보내고 싶다면 여기로 보내실 수 있습니다.
지원/저항
거래량
이동 평균
유틸리티/맞춤형
회귀 기반
변동성
오실레이터
__________________________________________________________________________________________
면책 조항
거래에는 위험이 따릅니다. 이 지표는 기술적 분석용으로만 의도되었으며 항상 적절한 위험 관리를 적용하고 책임감 있게 거래하십시오.
피드백 및 개선 사항
제안, 기능 요청 또는 개선 아이디어가 있으면 토론 탭에 댓글을 남겨주세요. 여러분의 피드백은 모든 사용자를 위한 지표 개선에 도움이 됩니다.
요약
Key features include dynamic color coding with lime indicating uptrends and red indicating downtrends, offering instant visual confirmation of trend direction through a noise-free, two-color design. Users can fine-tune the indicator’s responsiveness and smoothness via adjustable bandwidth and select a flexible lookback window ranging from 50 to 2000 bars to suit various timeframes and market conditions.
The indicator emphasizes mathematical precision and visual simplicity, requiring no complex settings. It is designed for traders seeking an adaptive smoothing method for trend identification without arbitrary period selection. This tool supports scalping strategies and is part of a broader suite of market analysis indicators focused on regression, volume, volatility, and custom timeframes.
고객 리뷰
5 | 100 % | |
4 | 0 % | |
3 | 0 % | |
2 | 0 % | |
1 | 0 % |


!["[Stellar Strategies] Market Session Ultimate" 로고](https://cdn.ctrader.com/image/webp/61ffd537-0125-4246-9e72-42eca1791d64_28232)