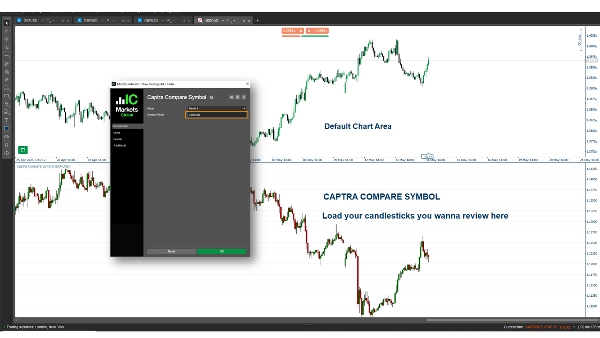
중개인 및 프랍
비즈니스용
00
Days
:
00
Hours
:
00
Minutes
:
00
Seconds
지표
EURUSD
Compare Symbol
03/09/2025
129
Desktop
가입일 08/05/2025
거래량
70.75M
핍 수익
998.69K
무료 설치
2295
"Compare Symbol" 업로드된 이미지

Captra Compare Symbol is a cTrader indicator that displays the close price and draws candlesticks (wick, body) for a selected symbol, like EURUSD, on the chart. It supports various timeframes (e.g., 5M, 15M, 1H, Daily) with customizable visuals, using open/close/high/low prices for accurate representation.

0.0
리뷰: 0
고객 리뷰
이 상품에 대한 리뷰가 아직 없습니다. 이미 사용해 보셨나요? 다른 사람들에게 가장 먼저 소개해 주세요!
이 작성자의 상품 더 보기
Order Block Finder
Order Block Detector is built to spot and display Order Blocks on chart, often triggering strong price reactions.
Head Shoulders Finder
Detects Head & Shoulders patterns, plots signals, and alerts for trading opportunities.
최고 평점
무료
High TF Plotter
Captra High TF Plotter visualizes high timeframe Bar on lower timeframe charts, highlighting with bull/bear colors.
Time Marker
CaptraTimeMarker: Marks key trading hours with lines & labels, plus daily separators for cTrader. Customizable & precise
Bar Explosion
cTrader indicator with mini-timeframe candlesticks. Customize timeframe, colors, margins. Perfect for traders.
좋아하실 만한 다른 항목
Alpha Sentiment Pro
Alpha Sentiment Pro - See the Market's Pulse Before It Moves
지표
VWAP
VolumeRenkoRange
Volume for Renko/Range
지표
VWAP
NAS100
Indices
+8
Vwap PRO
🔥Finally, the DEFINITIVE Vwap indicator for Ctrader: FULLY CUSTOMIZABLE 🚀
지표
Stocks
Forex
MACD
+1
SmartBot-Volume MACD
a revolutionary indicator that integrates volume into MACD.
지표
Grid
RSI
XAUUSD
+14
Trend Entropy pro
Entropy is the scientific measure of disorder or uncertainty in a system
지표
Grid
NAS100
XAUUSD
+6
AutoFibRetracement
A powerful overlay tool designed to automatically plot Fibonacci retracement levels based on a custom window.
지표
Forex
indicator
Multi-timeframe candlesticks!
EMA_RTH
Custom period EMA
지표
Scalping
ACTO-v1
ACTO: Oscillator tracking average candle duration to anticipate volatility shifts in trading.
Wstęgi DoubleSMMA
Wstęgi HTS
지표
Signal
FairValueGap-PremiumVersion1
This Fair Value Gap (FVG) indicator is a technical analysis on multi-timeframe.
지표
RSI
Breakout
XAUUSD
+4
Dynamic Market Structure Analysis of Turning Points
Identify market structure effortlessly with swing highs, lows, CHoCH, and BOS levels for smart trading decisions! 📊🔍"
지표
Signal
CVD
Cumulative Volume Delta tracks the net difference in tick volume between buying and selling pressure over time
지표
VWAP
Anchored VWAP Buttons
ReversalGuard
ReversalGuard Pro: Domina el Mercado con Zonas de Soporte y Resistencia de Alta Precisión"
지표
Grid
NAS100
RSI
+19
Smart Volume Delta
Detects smart money activity using advanced tick volume and price divergence analysis.
지표
Grid
Indices
Breakout
+9
crossover 1
Crossover Buy and Sell Alerts and signals