
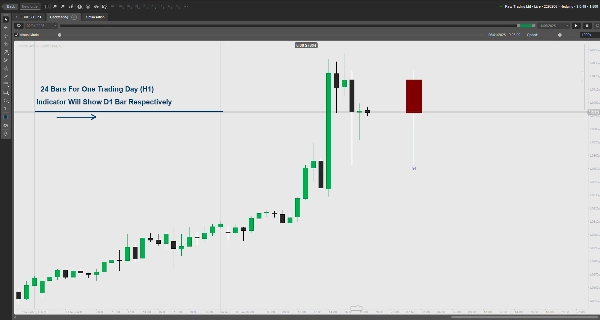
하위 TF 차트에 상위 TF 가격 움직임을 표시합니다. 시가/종가, 꼬리, 주요 구역을 강세/약세 색상으로 보여줍니다. 사용자 정의 가능.
주요 특징:
- 상위 타임프레임(예: 일간) 가격 움직임을 하위 타임프레임 차트에 오버레이합니다.
- 사용자 정의 가능한 강세/약세 색상의 시가/종가 가격 사각형을 표시합니다.
- 주요 가격 수준에 대한 꼬리 프리미엄/할인 구역을 강조 표시합니다.
- 차트 간격을 위한 설정 가능한 여백.
- 잘못된 타임프레임 설정에 대한 오류 처리.
도움이 되었는지 알려주시면 리뷰를 남겨주세요.
지표 프로필
4.6
리뷰: 3
5 | 67 % | |
4 | 33 % | |
3 | 0 % | |
2 | 0 % | |
1 | 0 % |
고객 리뷰
January 27, 2026
It would have been very helpful if it were possible to configure the time for NY EST
August 18, 2025
Clear higher timeframe level plotting, customizable, lightweight. Cons: No auto-labels, no multi-timeframe overlays, no alerts.
May 29, 2025
Muito bom, mas se tivesse a linha de abertura, máxima e mínima seria perfeito. Obrigada.
트레이딩 봇, 지표, 플러그인 등 cTrader Store에서 제공되는 상품은 제3자 개발자에 의해 제공되며, 이는 단순히 정보 및 기술적 접근을 목적으로 제공된 것입니다. cTrader Store는 중개인이 아니며, 투자 조언, 개인별 추천 또는 향후 성과에 대한 어떠한 보장도 제공하지 않습니다.
이 작성자의 상품 더 보기


좋아하실 만한 다른 항목


!["Smart Money Concepts (SMC) [Iridio Capital]" 로고](https://cdn.ctrader.com/image/webp/28b69fd1-ef54-4bed-9487-07e78e883be4_40934)


86.17M
거래량
1.91M
핍 수익
3.57K
무료 설치