
Compare Symbol
Indicatore
199 download
Versione 1.0, May 2025
Windows, Mac
Descrizione
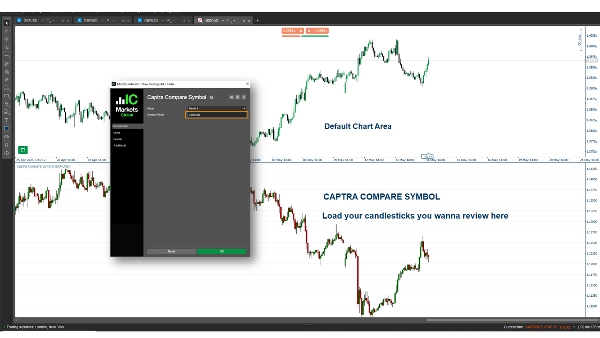
Captra Compare Symbol è un indicatore cTrader che mostra il prezzo di chiusura e disegna le candele (ombra, corpo) per un simbolo selezionato, come EURUSD, sul grafico. Supporta vari intervalli di tempo (ad esempio, 5M, 15M, 1H, Giornaliero) con elementi visivi personalizzabili, utilizzando i prezzi di apertura/chiusura/massimo/minimo per una rappresentazione accurata.
Riepilogo
Riepilogo AI
Captra Compare Symbol is a cTrader indicator that visualizes price data of a selected trading symbol, such as EURUSD, directly on the chart. It plots the close price and renders candlesticks—including wicks and bodies—using open, high, low, and close prices for precise representation. The indicator supports multiple timeframes, including 5-minute, 15-minute, 1-hour, and daily intervals. Visual elements are customizable to fit user preferences. This tool enables traders to compare the price action of an additional symbol alongside their primary chart, facilitating multi-symbol analysis within the cTrader platform.
Profilo indicatore
Recensioni dei clienti
0.0
Recensioni: 0
Recensioni dei clienti
Questo prodotto non ha ancora ricevuto recensioni. L'hai già provato? Fallo sapere agli altri per primo!
Discussioni
Domande frequenti
EURUSD
I prodotti disponibili tramite cTrader Store, inclusi bot di trading, indicatori e plugin, sono forniti da sviluppatori terzi e resi disponibili esclusivamente a scopo informativo e di accesso tecnico. cTrader Store non è un broker e non fornisce consulenze in materia di investimento, raccomandazioni individualizzate o garanzie di risultati futuri.
Altro da questo autore


![Logo di "[Hamster-Coder] Pivot Points (Demo)"](https://cdn.ctrader.com/image/webp/87b54299-8c73-4942-9207-4bc6db824811_31153)


Prezzo
86.62M
Volume negoziato
1.99M
Profitto in pip
3.66K
Installazioni gratuite