
Head Shoulders Finder
Indicatore
448 download
Versione 1.0, May 2025
Windows, Mac
5.0
Recensioni: 1
Descrizione
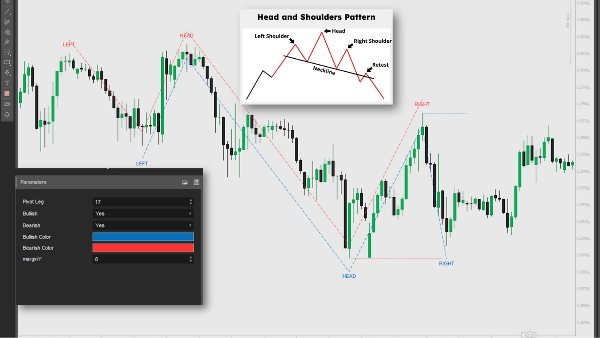
Questo indicatore identifica i pattern Testa e Spalle e Testa e Spalle Invertito analizzando i massimi e minimi pivot nei dati di prezzo. Traccia linee, etichette e segnali per potenziali inversioni di tendenza, attivando condizioni short quando il prezzo scende sotto la neckline (ribassista) o condizioni long quando è sopra (rialzista). I trader possono utilizzare questi segnali per entrare in posizioni short o long, combinandoli con altre analisi e la gestione del rischio per ottimizzare le strategie di trading.
Riepilogo
Riepilogo AI
The Head Shoulders Finder is a technical indicator designed to detect Head and Shoulders and Inverted Head and Shoulders chart patterns by analyzing pivot highs and lows in price data. It visually marks these patterns with lines and labels on the price chart, highlighting potential trend reversal points. The indicator generates trading signals by identifying when the price crosses the neckline: a break below signals a bearish trend reversal suitable for short positions, while a break above indicates a bullish reversal for long positions. Traders can use these signals alongside other technical analyses and risk management strategies to inform entry decisions. This tool supports pattern recognition and signal plotting to assist in identifying potential trading opportunities based on classic reversal formations.
Profilo indicatore
Recensioni dei clienti
5.0
Recensioni: 1
5 | 100 % | |
4 | 0 % | |
3 | 0 % | |
2 | 0 % | |
1 | 0 % |
Recensioni dei clienti
August 18, 2025
Automatically detects Head & Shoulders patterns, customizable visuals. Cons: No pattern reliability filter, no alerts, false signals on low TFs.
Discussioni
Domande frequenti
I prodotti disponibili tramite cTrader Store, inclusi bot di trading, indicatori e plugin, sono forniti da sviluppatori terzi e resi disponibili esclusivamente a scopo informativo e di accesso tecnico. cTrader Store non è un broker e non fornisce consulenze in materia di investimento, raccomandazioni individualizzate o garanzie di risultati futuri.
Altro da questo autore


Prezzo
86.67M
Volume negoziato
1.99M
Profitto in pip
3.66K
Installazioni gratuite