
VegaXLR - Analysis Tools Alerts
Indicatore
2 acquisti
Versione 1.1, Apr 2026
Windows, Mac
4.5
Recensioni: 2
Descrizione
cTrader Analysis Tools Alerts è un indicatore tutto-in-uno progettato per migliorare la tua esperienza di grafico aggiungendo avvisi, etichette e codifica colore automatica a vari strumenti di disegno.
Caratteristiche:
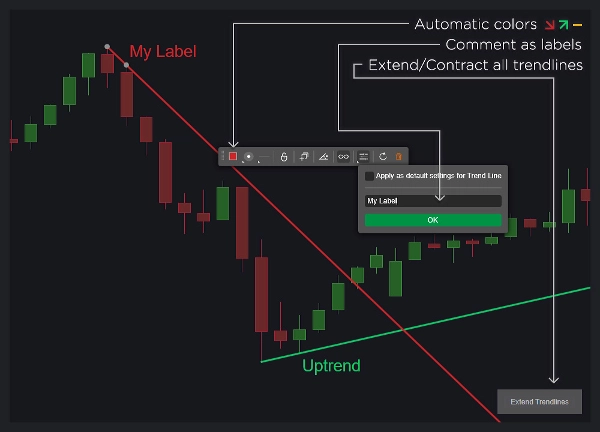
- Linee di tendenza:
-
- Visualizza etichette personalizzate utilizzando i commenti degli oggetti.
- Cambiamenti dinamici del colore basati sulla direzione della linea di tendenza.
- Opzione per rimuovere le linee di tendenza dopo un avviso.
- Abilita o disabilita gli avvisi specifici per le linee di tendenza.
- Estendi o contrai tutte le linee di tendenza con un solo clic.
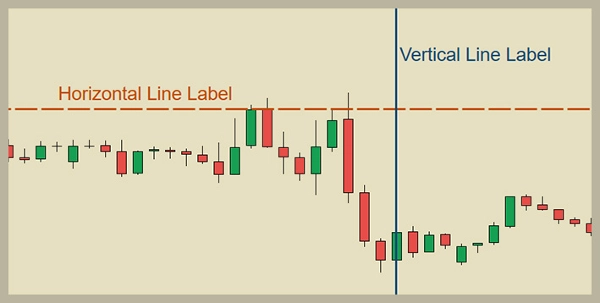
- Linee Orizzontali e Verticali:
-
- Visualizza etichette personalizzate utilizzando i commenti degli oggetti.
- Elimina automaticamente le linee dopo un avviso.
- Configura avvisi per ogni tipo di linea.
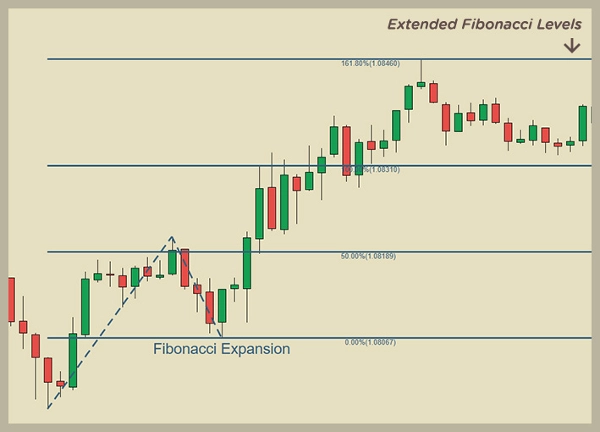
- Livelli di Ritracciamento ed Espansione di Fibonacci:
-
- Visualizza etichette personalizzate utilizzando i commenti degli oggetti.
- Estendi automaticamente le linee di livello all'infinito.
- Opzione per eliminare gli oggetti dopo un avviso.
- Assegna colori basati sulla direzione del disegno.
- Abilita o disabilita gli avvisi per i livelli di Fibonacci.
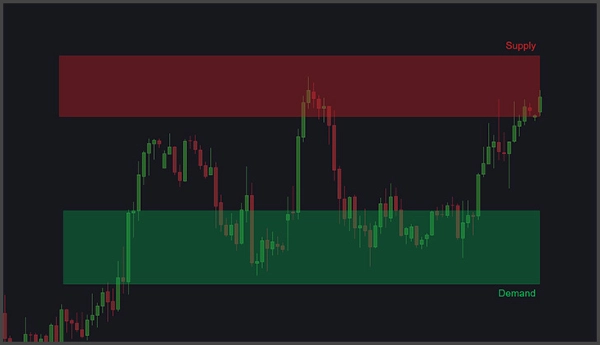
- Rettangoli (Aree di Offerta e Domanda):
-
- Visualizza etichette personalizzate utilizzando i commenti degli oggetti.
- Avvisi per interazioni di prezzo e picchi di volume tick.
- Imposta parametri per gli avvisi di picco di volume tick, inclusi barre di look-back, aumento percentuale del volume e periodo di pausa dopo l'avviso.
- Riempimento automatico del rettangolo ed estensione alla candela attiva.
- Personalizzazione Generale:
-
- Regola le posizioni delle etichette e le dimensioni del testo per ogni tipo di oggetto.
- Personalizza i colori automatici.
- Includi i commenti degli oggetti nei messaggi di avviso.
- Abilita o disabilita gli avvisi per ogni tipo di oggetto.
- Avvisi e Aiuto:
-
- Ricevi avvisi tramite suono, popup, Telegram ed email.
- Screenshot automatici del grafico inviati su Telegram.
- Guida utente accessibile tramite un piccolo pulsante sul grafico.
Questo strumento è ideale per i trader che utilizzano supporti e resistenze, offerta e domanda, Fibonacci o linee di tendenza nelle loro strategie.
Riepilogo
Riepilogo AI
VegaXLR - Analysis Tools Alerts is an all-in-one indicator for the cTrader platform that enhances chart analysis by integrating alerts, labels, and automatic color-coding with various drawing tools. It supports trendlines, horizontal and vertical lines, Fibonacci retracement and expansion levels, and rectangles representing supply and demand areas.
Key features include:
- Trendlines: Custom labels from object comments, dynamic color changes based on direction, options to remove or extend trendlines after alerts, and toggle alerts per trendline.
- Horizontal and Vertical Lines: Custom labels, automatic deletion after alerts, and configurable alerts per line type.
- Fibonacci Levels: Custom labels, infinite extension of level lines, color assignment by drawing direction, and alert enable/disable options.
- Rectangles (Supply and Demand): Custom labels, alerts for price interactions and tick volume spikes with adjustable parameters, automatic fill and extension to the active candle.
- Overall customization allows adjustment of label positions, text sizes, automatic colors, inclusion of comments in alerts, and enabling/disabling alerts per object type.
- Alerts can be received via sound, pop-ups, Telegram, and email, with automatic chart screenshots sent to Telegram.
- A user guide is accessible directly on the chart.
This tool is suited for traders employing support and resistance, supply and demand, Fibonacci, or trendline strategies.
Profilo indicatore
Categoria indicatore
Supporto e resistenza
Tipo di output
Visualizzazione
Requisiti per i dati
Solo barre
Segnali supportati
Superamento
Rottura
Livello raggiunto
Livello rotto
Inversione
Forza del trend
Recensioni dei clienti
4.5
Recensioni: 2
5 | 50 % | |
4 | 50 % | |
3 | 0 % | |
2 | 0 % | |
1 | 0 % |
Discussioni
Domande frequenti
Fibonacci
Forex
Supply & Demand
Support & Resistance
I prodotti disponibili tramite cTrader Store, inclusi bot di trading, indicatori e plugin, sono forniti da sviluppatori terzi e resi disponibili esclusivamente a scopo informativo e di accesso tecnico. cTrader Store non è un broker e non fornisce consulenze in materia di investimento, raccomandazioni individualizzate o garanzie di risultati futuri.


![Logo di "[Stellar Strategies] Market Session Ultimate"](https://cdn.ctrader.com/image/webp/61ffd537-0125-4246-9e72-42eca1791d64_28232)


Prezzo
230
Vendite
686
Installazioni gratuite