
Bar Explosion
Wskaźnik
204 pobrania
Wersja 1.0, May 2025
Windows, Mac
Opis
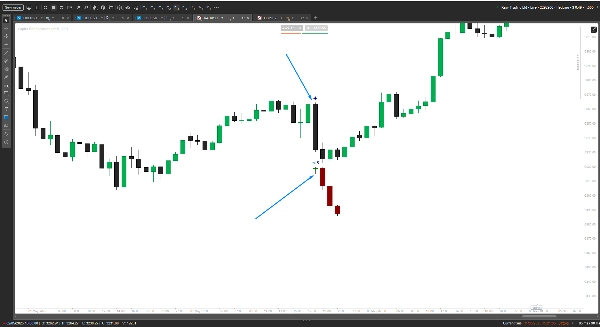
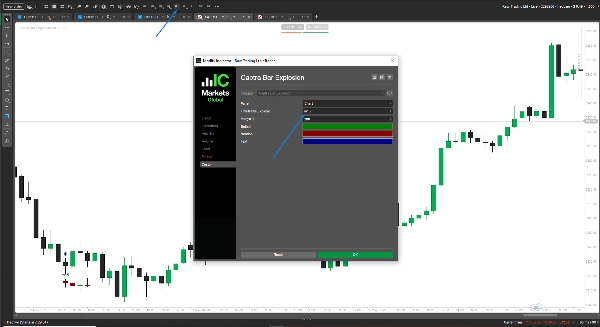
Uwolnij moc Captra's Bars Explosion, najwyższej klasy wskaźnika cTrader zaprojektowanego, aby zdominować Twoją grę handlową. To narzędzie nakłada wybuchowe wizualizacje świec na mini-interwałach czasowych, pozwalając Ci dostrzegać trendy z ostrą precyzją. Dostosuj interwał czasowy (np. Minute15), kolory (bycze/zielone, niedźwiedzie/ciemnoczerwone) oraz marginesy (domyślnie 30 pipsów) do swojego stylu. Idealny dla skalperów i traderów swingowych, stworzony dla cTrader z płynną wydajnością.
Prosimy o zostawienie recenzji, aby dać nam znać, czy jest pomocny.
Podsumowanie
Podsumowanie AI
Bar Explosion is a cTrader indicator that overlays mini-timeframe candlestick visuals onto your main chart, enabling precise trend identification. Users can customize the indicator’s timeframe (e.g., 15 minutes), colors for bullish (green) and bearish (dark red) bars, and margin settings (default 30 pips) to suit different trading styles. Designed for scalpers and swing traders, it provides detailed, smaller timeframe bar information directly on higher timeframe charts, enhancing market analysis without switching views. The indicator is optimized for smooth performance within the cTrader platform.
Profil wskaźnika
Opinie klientów
0.0
Opinie: 0
Opinie klientów
Ten produkt nie ma jeszcze opinii. Wypróbowałeś(-aś) go już? Bądź pierwszy(-a) i powiedz o tym innym!
Dyskusja
Częste pytania
Produkty dostępne za pośrednictwem cTrader Store, w tym boty handlowe, wskaźniki i wtyczki, dostarczane są przez deweloperów zewnętrznych i udostępniane wyłącznie w celach informacyjnych oraz w celu zapewnienia dostępu technicznego. cTrader Store nie jest brokerem i nie zapewnia doradztwa inwestycyjnego, nie udziela spersonalizowanych rekomendacji ani nie gwarantuje przyszłych wyników.
Więcej od tego autora


Cena
86.22M
Wolumen transakcji
1.92M
Zysk w pipsach
3.58K
Bezpłatne instalacje