
PIVOT POINTS, HIGH-LOW OF THE DAY
อินดิเคเตอร์
108 ดาวน์โหลด
เวอร์ชัน 1.0, Mar 2026
Windows, Mac
คำอธิบาย
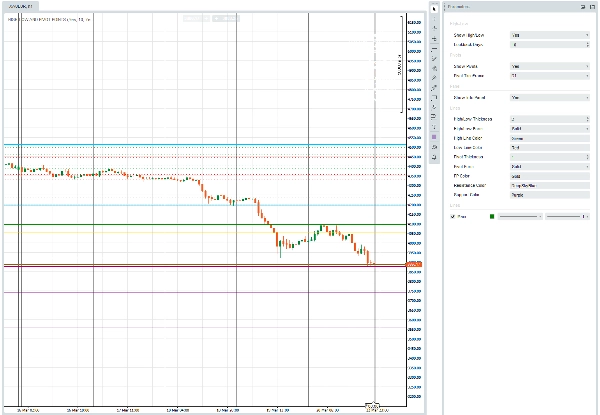
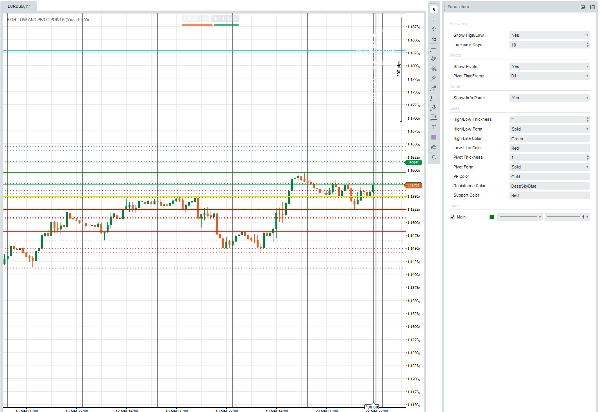
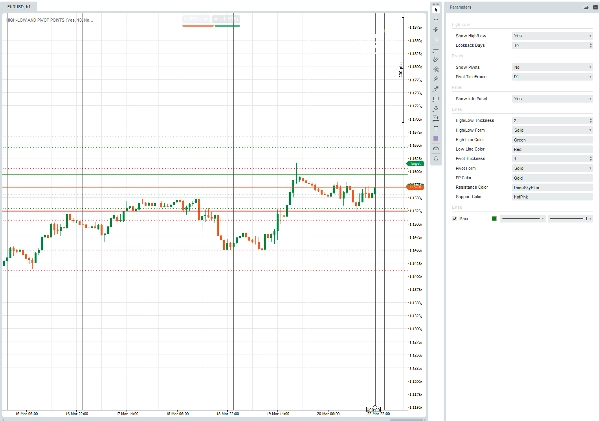
HIGH-LOW AND PIVOT POINTS เป็นตัวบ่งชี้แบบซ้อนทับของ cTrader ที่แสดงระดับราคาสูง/ต่ำรายวันและจุดหมุนคลาสสิกโดยตรงบนแผนภูมิของคุณ
พารามิเตอร์โดยย่อ:
กลุ่มสิ่งที่คุณควบคุม
High-Low
แสดง/ซ่อนเส้น; จำนวนวันที่ผ่านมาให้แสดง (Lookback Days)
Pivots
แสดง/ซ่อนเส้น; ช่วงเวลาที่ใช้คำนวณจุดหมุน (รายวัน รายสัปดาห์ ฯลฯ)
Panel
แสดง/ซ่อนกล่องข้อมูลบนแผนภูมิที่แสดงราคาปัจจุบันและระดับจุดหมุน
Lines
ความหนา, สไตล์ (ทึบ / จุด / จุดละเอียดมาก), และสีสำหรับเส้น High, Low, PP, Resistance, และ Support
สิ่งที่มันวาด:
- ราคาสูง/ต่ำของวันนี้ในสีที่คุณเลือก; วันที่ผ่านมาในเวอร์ชันที่มีสีอ่อนกว่า/เส้นบางกว่า
- เจ็ดระดับจุดหมุนมาตรฐาน — PP, R1–R3, S1–S3 — คำนวณจากแท่งก่อนหน้าที่เสร็จสมบูรณ์ของช่วงเวลาจุดหมุนที่คุณเลือก
- แผงข้อมูลด้านบนขวาสรุปราคาสูง/ต่ำของวันแบบสด, ช่วงเวลาย้อนหลังหลายวัน, และราคาจุดหมุนทั้งเจ็ดระดับ
สรุป
สรุปโดย AI
The "Pivot Points, High-Low of the Day" indicator for cTrader overlays daily high and low price levels along with classic pivot points directly on trading charts. It visually displays today's high and low prices, as well as those from prior days based on a configurable lookback period. The indicator calculates and plots seven standard pivot levels—Pivot Point (PP), Resistance levels R1 to R3, and Support levels S1 to S3—derived from the previous completed bar of a selectable timeframe (e.g., daily or weekly). Users can customize visibility, line thickness, style (solid, dotted, very dotted), and colors for all lines including high, low, pivot, resistance, and support. An optional on-chart info panel summarizes live day high/low, multi-day range, and all pivot prices for quick reference. This tool supports multiple markets and symbols including Forex pairs (EURUSD, GBPUSD, NZDUSD, USDJPY), cryptocurrencies (BTCUSD), commodities (XAUUSD), indices (NAS100), and stocks. It is designed to assist traders in identifying key price levels and potential breakout or reversal points based on historical price data and pivot calculations.
โปรไฟล์อินดิเคเตอร์
รีวิวจากลูกค้า
0.0
รีวิว: 0
รีวิวจากลูกค้า
ยังไม่มีรีวิวสำหรับผลิตภัณฑ์นี้ หากเคยลองแล้ว ขอเชิญมาเป็นคนแรกที่บอกคนอื่น!
การสนทนา
คำถามที่พบบ่อย
BTCUSD
Forex
Breakout
Indices
EURUSD
Commodities
GBPUSD
NZDUSD
Crypto
Stocks
XAUUSD
NAS100
USDJPY
ผลิตภัณฑ์ที่มีให้บริการผ่าน cTrader Store รวมถึงบอทการเทรด อินดิเคเตอร์ และปลั๊กอิน มีให้บริการโดยนักพัฒนาบุคคลที่สามและมีไว้เพื่อวัตถุประสงค์ในการเข้าถึงข้อมูลและทางเทคนิคเท่านั้น cTrader Store ไม่ใช่โบรกเกอร์และไม่ได้ให้คำแนะนำการลงทุน คำแนะนำส่วนบุคคล หรือการรับประกันผลการดำเนินงานในอนาคต
เพิ่มเติมจากผู้เขียนคนนี้


ราคา
49
การขาย
306
ติดตั้งฟรี