

RSI Velocity Gauge
อินดิเคเตอร์
102 ดาวน์โหลด
เวอร์ชัน 1.0, May 2026
Windows, Mac
4.5
รีวิว: 2

ตั้งแต่ 27/02/2026
33.16K
ปริมาณการเทรด
25.96K
Pips ที่ได้กำไร
10
การขาย
510
ติดตั้งฟรี
คำอธิบาย
ฟรีสำหรับทุกคน
🏎️ RSI Velocity Gauge Pro 📊
สุดยอด HUD แรงโมเมนตัมแบบเรียลไทม์ & ตัวแสดงแนวโน้มสำหรับ cTrader
เปลี่ยนวิธีที่คุณดูแรงโมเมนตัมของตลาดด้วย RSI Velocity Gauge Pro ลาก่อนหน้าต่างย่อยออสซิลเลเตอร์ที่ยุ่งเหยิงและแยกออกจากกัน ตัวบ่งชี้ระดับพรีเมียมนี้จะซ้อนแผงหน้าปัดกลไกที่ดูเรียบหรูโดยตรงบนแผนภูมิของคุณ ให้การอ่านความเร็วตลาด ความแข็งแกร่ง และจุดอิ่มตัวอย่างทันทีและมีความละเอียดสูง
ออกแบบด้วยการปรับขนาด UI ทางตรีโกณมิติขั้นสูงและตรรกะการวาดแผนภูมิสด นี่ไม่ใช่แค่ตัวบ่งชี้—แต่เป็นศูนย์ควบคุมบริหารจัดการเต็มรูปแบบสำหรับเลย์เอาต์การเทรดของคุณ
⚡ คุณสมบัติหลัก
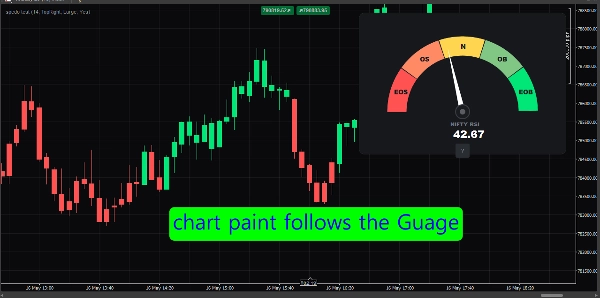
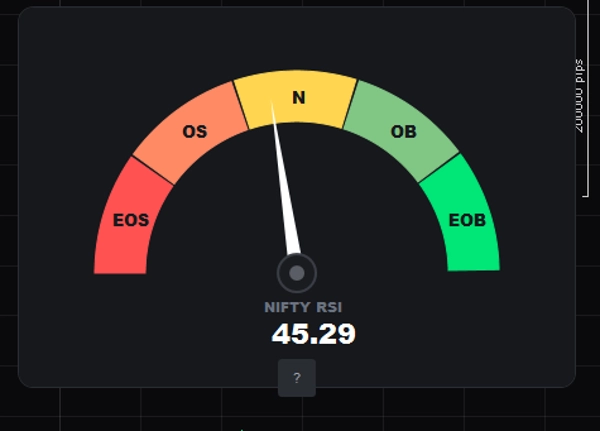
- 🧭 แผงหน้าปัดกลไกแบบไดนามิก: มาตรวัดความเร็วแบบรัศมีโหมดมืดที่สวยงามซึ่งติดตาม Relative Strength Index (RSI) แบบสดในทุกๆ การเคลื่อนไหวของราคา
- 🎨 การใช้สีที่ถูกต้องตามจิตวิทยา: กลับสีอย่างสมบูรณ์แบบเพื่อให้ตรงกับแรงกดดันตลาดแบบเรียลไทม์ ด้านซ้ายแสดงถึงการควบคุมของผู้ขายอย่างล้นหลาม (แดง/ส้ม) ขณะที่ด้านขวาแสดงความเร็วของผู้ซื้ออย่างรุนแรง (เขียว/มิ้นท์)
- 🕯️ การวาดแท่งเทียนอัจฉริยะ: จับตาดูการเคลื่อนไหวของราคาอย่างใกล้ชิด ตัวบ่งชี้จะวาดแท่งเทียนบนแผนภูมิของคุณเป็นสีเขียวในช่วงโมเมนตัมขาขึ้น (RSI > 50) และสีแดงในช่วงสภาพตลาดขาลง (RSI < 50)
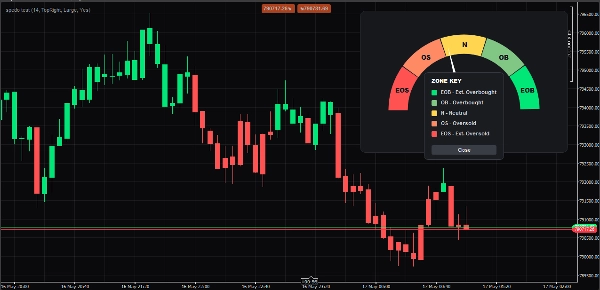
- 🧠 ปุ่มแสดงคำอธิบายแบบป๊อปอัพโต้ตอบ (
?): รักษาความสะอาดและความเรียบง่ายของแผนภูมิของคุณ คลิกปุ่มวงกลมโต้ตอบ?เพื่อสลับแสดงกุญแจโซนที่สวยงามและยกระดับซึ่งแสดงคำย่อที่แน่นอนและสีที่สอดคล้องกันทันที - 📐 การปรับขนาด UI ที่ตอบสนองเต็มที่: เลือกระหว่างมุมมอง ขนาดเล็ก กลาง หรือใหญ่ ตัวบ่งชี้คำนวณเรขาคณิต ขนาดตัวอักษร ระยะขอบ และรัศมีขอบทั้งหมดอย่างไดนามิกเพื่อให้พอดีกับความละเอียดหน้าจอใดๆ (รวมถึง 4K)
- 📍 การจัดตำแหน่งมุมที่ยืดหยุ่น: เลื่อนมาตรวัดออกจากพื้นที่สำคัญของการเคลื่อนไหวราคาได้อย่างง่ายดาย สลับตำแหน่งระหว่างมุมบนซ้าย บนขวา ล่างซ้าย หรือ ล่างขวาพร้อมการปรับช่องว่างอัตโนมัติ
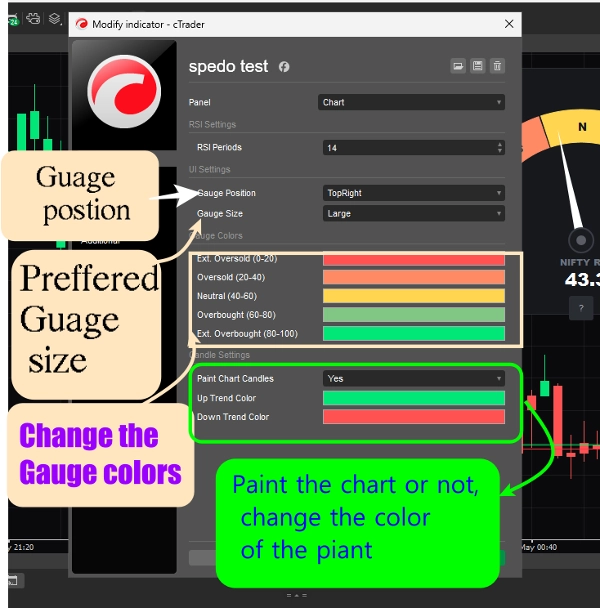
- 🎛️ ตัวเลือกสีในตัว: ไม่ต้องใช้รหัสสีเฮกซ์ที่ยุ่งยาก! ปรับแต่งสีของทุกโซนทั้ง 5 และแท่งเทรนด์โดยใช้ตารางสีแบบเลื่อนลงที่ไร้รอยต่อของ cTrader
🔍 กุญแจคำอธิบายโซน
คลิกปุ่ม ? ภายในแผงหน้าปัดของคุณเพื่อดูข้อกำหนดโซนที่กำหนดเองของคุณ:
- 🟥 EOS (ขายมากเกินไปขั้นสุด | 0–20): จุดอิ่มตัวของการขายสูงสุด โซนที่อาจเกิดการกลับตัว
- 🟧 OS (ขายมากเกินไป | 20–40): ความเร็วขาลงที่แข็งแกร่ง ผู้ขายควบคุมอย่างแน่นหนา
- 🟨 N (เป็นกลาง | 40–60): โซนสมดุลของตลาด การเคลื่อนไหวด้านข้างหรือการรวมตัว
- 🟩 OB (ซื้อมากเกินไป | 60–80): ความเร็วขาขึ้นที่แข็งแกร่ง ผู้ซื้อควบคุมอย่างแน่นหนา
- 🟩 EOB (ซื้อมากเกินไปขั้นสุด | 80–100): จุดอิ่มตัวของการซื้อสูงสุด โซนอาจเกิดการดึงกลับ
⚙️ พารามิเตอร์ที่ปรับแต่งได้
- การตั้งค่า RSI: ปรับช่วงเวลาการคำนวณของคุณได้อย่างง่ายดาย (ค่าเริ่มต้น: 14)
- การจัดตำแหน่ง UI: ตัวเลือกเลย์เอาต์แบบเลื่อนลง (มุมบนซ้าย, มุมบนขวา, มุมล่างซ้าย, มุมล่างขวา)
- ขนาด UI: ตัวปรับขนาดตอบสนองแบบไร้รอยต่อ (เล็ก, กลาง, ใหญ่)
- สีของมาตรวัด: ตัวเลือกพาเลตต์อิสระสำหรับทุกแถบโมเมนตัมทั้ง 5
- การตั้งค่าแท่งเทียน: สวิตช์เปิด/ปิดทั่วโลกสำหรับการวาดแท่งเทียนพื้นหลัง พร้อมตัวเลือกแปรงเทรนด์ขึ้นและลงแบบกำหนดเอง
สรุป
AI summary
The RSI Velocity Gauge is a momentum indicator designed for cTrader that overlays a dynamic, mechanical-style dashboard directly on trading charts. It provides real-time tracking of the Relative Strength Index (RSI) on every tick, visualized as a radial speedometer with color-coded zones indicating market momentum and pressure. The gauge uses a dark-mode interface with colors representing seller dominance (red/orange) and buyer dominance (green/mint).
Key features include automatic candle coloring to reflect bullish (green) or bearish (red) momentum based on RSI values, an interactive pop-up legend explaining zone meanings, and fully responsive UI scaling with adjustable sizes (small, medium, large) and corner positioning options. Users can customize RSI calculation periods, gauge colors for five momentum bands, and toggle candle painting on or off.
The indicator divides RSI values into five zones: Extreme Oversold (0–20), Oversold (20–40), Neutral (40–60), Overbought (60–80), and Extreme Overbought (80–100), helping identify potential reversal or exhaustion points. The RSI Velocity Gauge serves as a comprehensive momentum visualization tool, integrating smoothly into trading layouts for enhanced market speed, strength, and trend analysis.
Key features include automatic candle coloring to reflect bullish (green) or bearish (red) momentum based on RSI values, an interactive pop-up legend explaining zone meanings, and fully responsive UI scaling with adjustable sizes (small, medium, large) and corner positioning options. Users can customize RSI calculation periods, gauge colors for five momentum bands, and toggle candle painting on or off.
The indicator divides RSI values into five zones: Extreme Oversold (0–20), Oversold (20–40), Neutral (40–60), Overbought (60–80), and Extreme Overbought (80–100), helping identify potential reversal or exhaustion points. The RSI Velocity Gauge serves as a comprehensive momentum visualization tool, integrating smoothly into trading layouts for enhanced market speed, strength, and trend analysis.
โปรไฟล์อินดิเคเตอร์
หมวดหมู่อินดิเคเตอร์
Momentum
ประเภทเอาต์พุต
การแสดงเป็นภาพ
ตัวกรอง
สัญญาณ
ข้อกำหนดด้านข้อมูล
แท่งเท่านั้น
ข้อมูล Tick
ปริมาณ
DoM
ข้อมูลภายนอก
สัญญาณที่รองรับ
ความผันผวน
ความแข็งแกร่งของแนวโน้ม
เบรก Level ที่ระบุ
แตะ Level ที่ระบุ
Reversal
Cross
Divergence
Breakout
รีวิวจากลูกค้า
4.5
รีวิว: 2
5 | 50 % | |
4 | 50 % | |
3 | 0 % | |
2 | 0 % | |
1 | 0 % |
รีวิวจากลูกค้า
September 10, 2026
RSI Velocity Gauge provides a clear radial RSI HUD, accurate zone mapping, candle coloring and a useful interactive legend. Testing on EURUSD and XAUUSD worked well across M1–D1. The main issue is the incorrect hard-coded “NIFTY RSI” label shown on other symbols; live per-tick updating was not independently verified.
การสนทนา
คำถามที่พบบ่อย
RSI
AI-assisted
Moving Average
ผลิตภัณฑ์ที่มีให้บริการผ่าน cTrader Store รวมถึงบอทการเทรด อินดิเคเตอร์ และปลั๊กอิน มีให้บริการโดยนักพัฒนาบุคคลที่สามและมีไว้เพื่อวัตถุประสงค์ในการเข้าถึงข้อมูลและทางเทคนิคเท่านั้น cTrader Store ไม่ใช่โบรกเกอร์และไม่ได้ให้คำแนะนำการลงทุน คำแนะนำส่วนบุคคล หรือการรับประกันผลการดำเนินงานในอนาคต















!["[Stellar Strategies] Market Session Ultimate" โลโก้](https://cdn.ctrader.com/image/webp/61ffd537-0125-4246-9e72-42eca1791d64_28232)






ราคา
ตั้งแต่ 27/02/2026
33.16K
ปริมาณการเทรด
25.96K
Pips ที่ได้กำไร
10
การขาย
510
ติดตั้งฟรี