
LT_FairValueGap
Chỉ báo
1 lượt mua
Phiên bản 1.0, Jun 2025
Windows, Mac
5.0
Đánh giá: 1
Mô tả
Lưu ý: Đã thử nghiệm chỉ trên cTrader Windows.
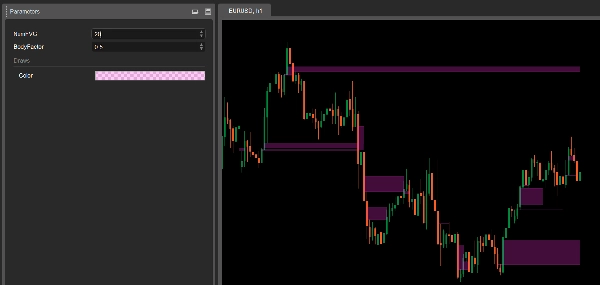
LT_FairValueGap là một chỉ báo Fair Value Gap nhẹ và mạnh mẽ được thiết kế cho các nhà giao dịch hành động giá chính xác. Nó làm nổi bật các vùng mất cân bằng theo phong cách tổ chức sử dụng logic 3 thanh nghiêm ngặt và loại bỏ chúng khi giá quay lại vùng trống — mang đến cho bạn các vùng rõ ràng, có thể hành động để vào lệnh, thoát lệnh hoặc đồng thuận.
🔍 Cách Hoạt Động
- Một Fair Value Gap (FVG) được xác định khi một cây nến giữa mạnh (với thân lớn) tạo ra sự mất cân bằng giữa hai cây nến liền kề.
- Khoảng trống được đánh dấu như một vùng hỗ trợ/kháng cự tạm thời (SR).
- Khi giá quay lại và lấp đầy khoảng trống, vùng này không còn được mở rộng — đảm bảo biểu đồ luôn gọn gàng và phù hợp.
⚙️ Tham Số
- NumFVG: Số lượng tối đa các vùng FVG hiển thị trên biểu đồ.
- BodyFactor: Ngưỡng sức mạnh cho thanh giữa (mặc định:
2.0×trung bình thân của 20 thanh gần nhất).
✅ Tính Năng Chính
- Phát hiện khoảng trống theo phong cách tổ chức (logic 3 thanh)
- Biểu đồ sạch — các vùng ngừng mở rộng khi bị chạm
- Độ nhạy có thể điều chỉnh qua BodyFactor
- Cắm và chạy: cấu hình tối thiểu
📌 Trường Hợp Sử Dụng
- Xác định các vùng mất cân bằng và phản ứng theo phong cách tổ chức
- Sử dụng làm điểm đồng thuận vào lệnh hoặc đánh dấu vô hiệu
- Kết hợp với cấu trúc swing hoặc công cụ khối lượng
Dù bạn đang giao dịch phá vỡ, giảm nhẹ hay đảo chiều, LT_FairValueGap giúp bạn phát hiện các vùng mất cân bằng thực sự quan trọng — không kèm theo nhiễu.
Tóm tắt
Hồ sơ chỉ báo
Đánh giá của khách hàng
5.0
Đánh giá: 1
5 | 100 % | |
4 | 0 % | |
3 | 0 % | |
2 | 0 % | |
1 | 0 % |
Đánh giá của khách hàng
June 25, 2025
Ngl, market notes are quicker to compare and that is enough to keep testing it. It should not replace the chart.
Thảo luận
Câu hỏi thường gặp
Forex
Các sản phẩm có sẵn trên cTrader Store, bao gồm bot giao dịch, chỉ báo và plugin, được cung cấp bởi các nhà phát triển bên thứ ba và chỉ nhằm mục đích cung cấp thông tin và tiếp cận kỹ thuật. cTrader Store không phải là nhà môi giới và không cung cấp lời khuyên đầu tư, khuyến nghị cá nhân hay bất kỳ đảm bảo nào về hiệu suất trong tương lai.


Giá
Kể từ 25/09/2024
34
Lượt bán