
Descripción
Escáner de Tendencias Multitemporales – Lea la Historia Completa del Mercado de un Vistazo
Escáner de Tendencias Multitemporales le ofrece una vista limpia y compacta de la tendencia a través de múltiples marcos temporales directamente en su gráfico de cTrader – desde M5 hasta D1 – además de una clara inclinación general de trading:
➡️ Compra FUERTE / Compra / NEUTRO / Venta / Venta FUERTE
En lugar de saltar entre gráficos y adivinar, obtiene un mapa estructurado de tendencias multitemporales en un solo lugar.
🧠 Motor Inteligente de Puntuación de Tendencias
Para cada marco temporal habilitado (M5, M15, M30, H1, H4, D1), el indicador calcula una puntuación robusta de la tendencia usando tres componentes clave:
- 📈 EMA (dirección y pendiente de la tendencia)
-
- Precio vs EMA (por encima/debajo)
- Pendiente de la EMA (ascendente/descendente)
- 💪 RSI (momentum)
-
- Normalizado alrededor del nivel 50
- 🌊 ATR (filtro de volatilidad opcional)
-
- Opcionalmente ignorar condiciones de volatilidad ultra baja
Cada marco temporal recibe una puntuación en el rango -100 a +100, que luego se traduce en un estado fácil de entender:
- 🟢 ALZA – sesgo alcista
- 🔴 BAJA – sesgo bajista
- 🟡 PLANO – lateral / poco claro
Ves instantáneamente qué marcos temporales coinciden y dónde está el sesgo direccional real.
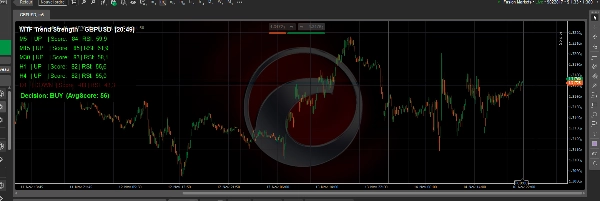
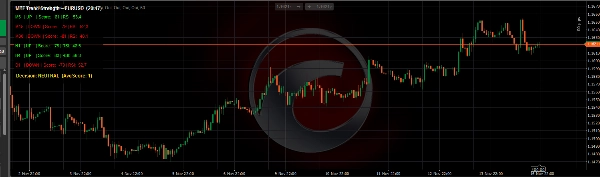
📊 Panel Limpio y Ligero en el Gráfico
La herramienta dibuja un pequeño panel de interfaz sobre su gráfico, diseñado para ser legible pero no intrusivo:
- Una línea por marco temporal, por ejemplo:
M15 | ALZA | Puntuación: 63 | RSI: 61.2 - Codificado por colores:
-
- Verde para ALZA
- Rojo para BAJA
- Dorado para PLANO
- El panel puede colocarse en la esquina superior izquierda o en la esquina superior derecha
- Panel ajustable:
-
- Color y opacidad de fondo
- Tamaño de fuente
- Altura de línea
- Colores para alcista / bajista / neutral
Perfecto para scalpers, traders diarios y traders de swing que quieren confirmar rápidamente el panorama general.
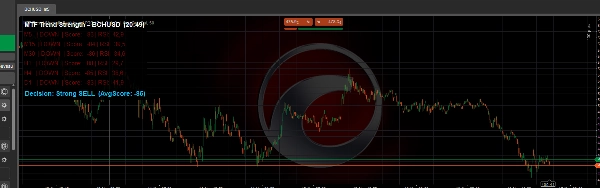
🧭 Línea de Sesgo Global de Trading
En la parte inferior del panel, Escáner de Tendencias Multitemporales calcula la puntuación promedio de todos los marcos temporales activos y la convierte en un sesgo global claro:
- ✅ Compra FUERTE – fuerte alineación alcista entre marcos temporales
- ✅ Compra – sesgo alcista, pero no extremo
- ⚪ NEUTRO – mercado mixto o inestable
- ❌ Venta – sesgo bajista
- ❌ Venta FUERTE – fuerte alineación bajista
Esto lo hace ideal como filtro de tendencia y dirección para:
- Trading manual (solo operar en la dirección del sesgo)
- Entradas de scalping con confirmación de marco temporal superior
- Trading de swing alineado con H1 / H4 / D1
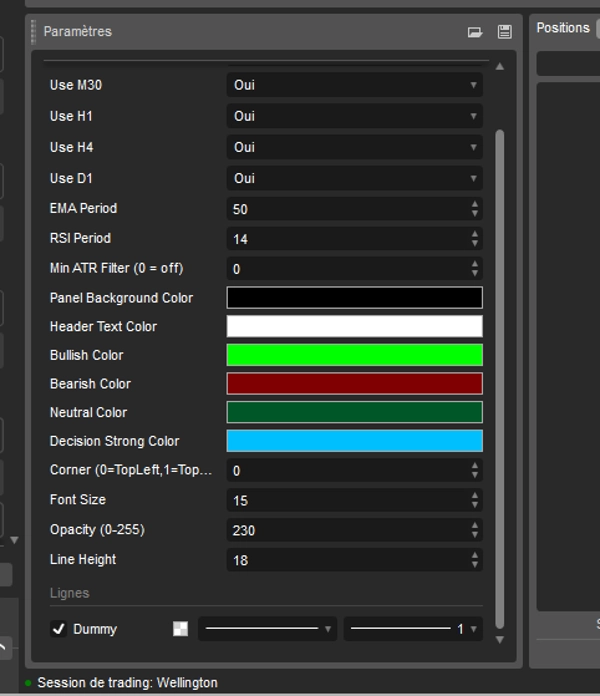
🔧 Totalmente Personalizable
Usted mantiene el control total sobre la lógica y la apariencia:
- Habilitar/deshabilitar cada marco temporal (M5, M15, M30, H1, H4, D1)
- Configurar:
-
- Período EMA (sensibilidad de la tendencia)
- Período RSI (comportamiento del momentum)
- Filtro mínimo ATR (0 = desactivado)
- Configuraciones visuales:
-
- Color y transparencia del fondo del panel
- Colores del texto del encabezado y líneas
- Colores para alcista / bajista / neutral / sesgo fuerte
- Tamaño de fuente y espaciado entre líneas
El indicador funciona con cualquier símbolo soportado por cTrader: forex, índices, oro, criptomonedas, acciones.
Si desea una forma clara, objetiva y visual de leer la alineación de tendencias a través de múltiples marcos temporales y decidir rápidamente si el mercado es más adecuado para comprar, vender o mantenerse al margen, Escáner de Tendencias Multitemporales es una poderosa adición a su caja de herramientas de cTrader.
Resumen
The indicator displays a compact, color-coded dashboard on the chart, showing one line per timeframe with trend status, score, and RSI value. Users can customize the panel’s position, colors, font size, and which timeframes to include. A global trading bias line at the bottom summarizes the average score across timeframes into five bias states: Strong BUY, BUY, NEUTRAL, SELL, and Strong SELL. This feature supports manual trading, scalping, and swing trading by providing clear directional guidance.
Multi Timeframe Trend Scanner works on any cTrader-supported symbol, including forex, indices, commodities, cryptocurrencies, and stocks. It is designed to help traders quickly assess trend alignment and market bias in a single, easy-to-read interface.
Valoraciones de clientes
5 | 100 % | |
4 | 0 % | |
3 | 0 % | |
2 | 0 % | |
1 | 0 % |


![Logotipo de "[Hamster-Coder] Bollinger Bands"](https://cdn.ctrader.com/image/webp/21d8e5d6-fb11-4bac-b9ee-cd05c2b76804_30327)
