Descrição
VISÃO GERAL
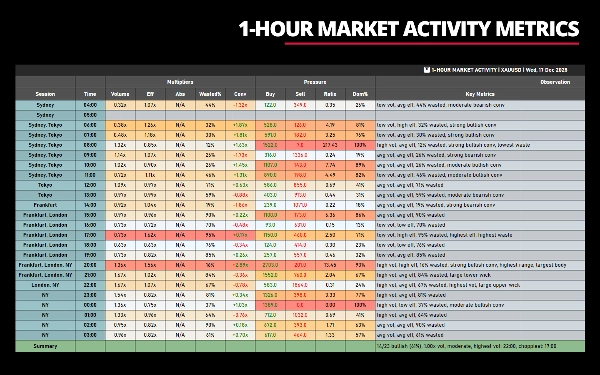
Analisador de Eficiência de Volume é uma ferramenta abrangente de análise barra a barra que mede a relação entre volume (esforço) e movimento de preço (resultado). Foi originalmente desenvolvido para uso pessoal para responder a uma pergunta específica: "O mercado está se movendo de forma eficiente, ou há muita atividade sem progresso significativo?"
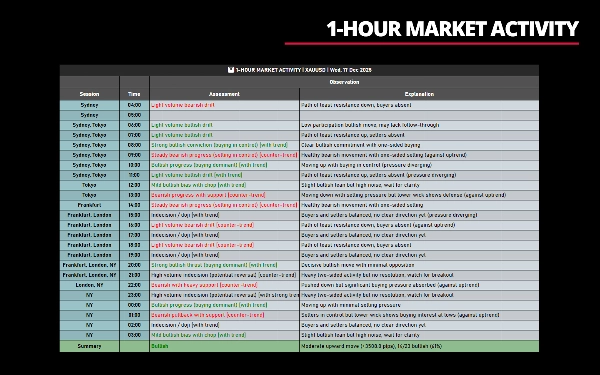
Este indicador NÃO produz nenhuma saída gráfica. Ele exibe análise estatística e métricas apenas em formato de tabela—sem linhas, sinais ou sobreposições de preço. Essas métricas medem e quantificam a qualidade e as características da ação do preço e do comportamento do mercado, ajudando você a entender se os movimentos são decisivos, exaustos, contestados ou indecisos—após ocorrerem.
__________________________________________________________________________________________
EM RESUMO
Saída: Dados estatísticos (sem gráficos)
Exibição: Formato de tabela
Intervalos de tempo: Subdiário até mensal
Métricas: Mais de 20 indicadores de eficiência/pressão
Melhor para: Análise de volume, avaliação de qualidade
__________________________________________________________________________________________
CONCEITO CENTRAL: ESFORÇO VS RESULTADO
A premissa fundamental é simples:
- Esforço = Volume de Ticks (atividade de negociação)
- Resultado = Movimento de preço (faixa, corpo, variação líquida)
Mercados eficientes produzem movimento substancial de preço com volume razoável—os movimentos são limpos e decisivos.
Mercados ineficientes mostram alto volume mas progresso líquido limitado—os movimentos são irregulares, contestados ou absorvidos.
Ao medir essa relação entre barras individuais e períodos agregados, você pode identificar:
- Condições de tendência vs. lateralização
- Compromisso vs. indecisão
- Exaustão vs. continuação
- Mercados unilaterais vs. bilaterais
__________________________________________________________________________________________
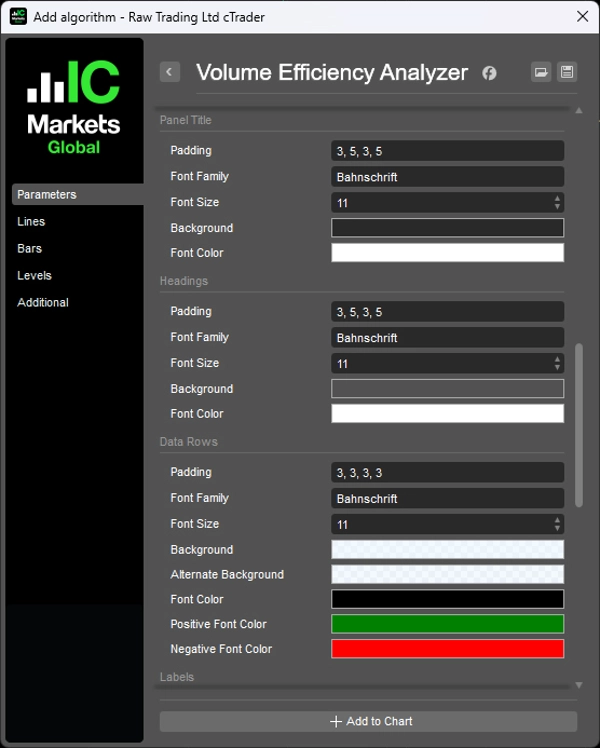
CONFIGURAÇÃO DOS PARÂMETROS PRINCIPAIS
Estes cinco parâmetros controlam quais dados o indicador exibe. Entender como eles funcionam é crucial para o uso eficaz.
1. Parâmetro de Data
Propósito: Define qual data/período analisar.
Exemplos de Formato:
""(vazio) – Dia de negociação mais recente com dados"18/12/2025"– Data específica (DD/MM/AAAA)"12/2025"– Mês inteiro (MM/AAAA)"2025"– Ano inteiro (AAAA)
2. Parâmetro TimeRange
Propósito: Filtra quais horas exibir em intervalos subdiários.
Aplica-se a: Apenas intervalos subdiários (1 minuto a 1 hora)
Exemplos de Formato:
""(vazio) – Dia completo de negociação de 24 horas"8-16"– 8:00 às 16:00"08:00-16:30"– 8:00 às 16:30"14"– 14:00 até o horário atual
3. Parâmetro WeeksRange
Propósito: Filtra quais semanas do mês exibir.
Aplica-se a: Apenas intervalos multi-hora (2 horas a 12 horas)
Exemplos de Formato:
""(vazio) – Todas as semanas do mês"1"– Apenas a primeira semana"1,3"– Semanas 1 e 3"2,3,4"– Semanas 2, 3 e 4
4. Parâmetro MonthsRange
Propósito: Filtra quais meses do ano exibir.
Aplica-se a: Apenas intervalos semanais
Exemplos de Formato:
""(vazio) – Todos os meses do ano"1"– Apenas janeiro"1,6,12"– Janeiro, junho, dezembro"3,4,5,9,10,11"– 1º trimestre (primavera) e 4º trimestre (outono)
5. Parâmetro MaxDataRows
Propósito: Limita quantas linhas (barras) são exibidas na tabela.
Aplica-se a: Todos os intervalos de tempo
Valor padrão: 24
Formato:
-1ou0– Mostrar todos os dados disponíveis (sem limite)- Qualquer número positivo – Mostrar no máximo esse número de linhas
__________________________________________________________________________________________
RECURSOS
Flexibilidade
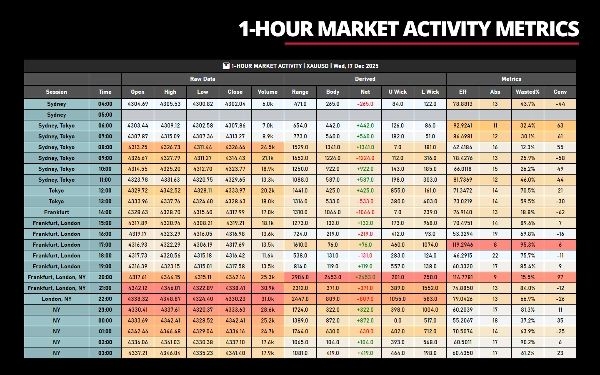
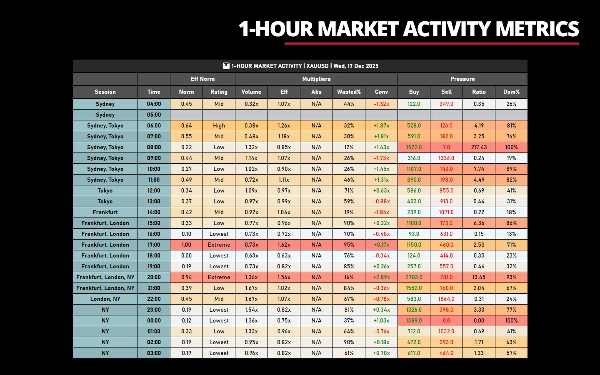
- 8 Grupos de Colunas: Alterna visibilidade de Dados Brutos, Derivados, Métricas, Normalização de Eficiência, Multiplicadores, Pressão, Observações Chave, Métricas Chave
- Múltiplos Intervalos de Tempo: Funciona em subdiários (1m-1h), multi-hora (2h-12h), diário, semanal e mensal
- Filtragem: Filtro de intervalo de tempo (ex.: "8:00-16:00"), filtro de semana (ex.: "1,3"), filtro de mês (ex.: "1,6,12")
- Máximo de Linhas: Limita exibição aos N períodos mais recentes ou centraliza na barra em formação
- Realce de Cor: Realce opcional em gradiente para qualquer grupo de colunas baseado na métrica selecionada
- Estilo Personalizável: Controle total sobre fontes, cores, espaçamento, larguras de coluna
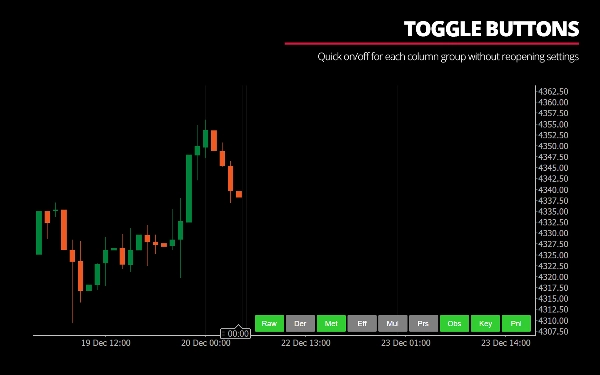
- Botões de Alternância: Liga/desliga rápido para cada grupo de colunas sem reabrir configurações
Suporte a Fuso Horário
- Ajusta para horário do servidor do corretor vs. seu horário local
- Horas de início de sessão configuráveis (Sydney, Tóquio, Frankfurt, Londres, NY)
- Início do dia de negociação por hora (ex.: 4:00 AM para traders da sessão asiática)
Otimizações de Desempenho
- Busca binária para consultas eficientes de barras
- Cálculos de min/máx em passagem única para realce
- Limitação de 500ms em atualizações em tempo real para evitar lentidão
- Dicas de busca para evitar consultas redundantes
__________________________________________________________________________________________
COMPREENDENDO AS MÉTRICAS
O que faz um Bom Movimento?
- Alta Eficiência: Percorreu uma grande distância com pouco volume
- Baixo % Desperdiçado: Mínimos pavios, corpos direcionais limpos
- Pressão Alinhada: Pressão de compra dominante em fechamentos altistas (ou vice-versa)
- Forte Convicção: Alto compromisso direcional
O que faz um Fraco Movimento?
- Baixa Eficiência: Exigiu muito volume para se mover pouco
- Alto % Desperdiçado: Grandes pavios, corpos pequenos (movimento irregular)
- Pressão Contraditória: Fechamento altista mas pressão de venda dominante
- Convicção Fraca: Sem compromisso direcional apesar do volume
O que significa Absorção?
Quando o preço tem dificuldade para se mover apesar do alto volume, o mercado está "absorvendo" esse volume. Isso indica:
- Alta Absorção: Resistência/suporte presente, difícil mover o preço
- Baixa Absorção: Movimento fácil, pouca oposição
Exemplos de Interpretação:
"Forte impulso altista (compra dominante)"
- Alto volume + Alta eficiência + Baixo desperdício + Líquido altista + Pressão de compra dominante
"Indecisão de alto volume (potencial reversão)"
- Alto volume + Desperdício extremo + Corpo pequeno + Pressão equilibrada
"Fechamento altista apesar da pressão baixista"
- Fechou em alta mas a pressão de venda excedeu a de compra (divergência, potencial armadilha)
"Baixa participação, sem compromisso"
- Baixo volume + Eficiência média + Sem dominância clara de pressão
__________________________________________________________________________________________
VANTAGENS E BENEFÍCIOS
1. Quantifica a Intuição
- Se você já sentiu "isso parece irregular" ou "esse movimento parece fraco", este indicador quantifica essas observações
- Fornece métricas objetivas para avaliações subjetivas
2. Análise Multidimensional
- A maioria das ferramentas mostra volume OU padrões de preço. Esta mostra a relação entre eles
- Combina volume, estrutura de preço, viés direcional e dinâmica de pressão em uma única visão
3. Consciente do Contexto
- Avaliações de barras individuais consideram o contexto da tendência
- Distingue entre "consolidação em alta" vs. "consolidação em baixa"
- Sinaliza movimentos contra-tendência que podem ser armadilhas
4. Educacional
- Interpretações em linguagem natural ajudam você a aprender a dinâmica do mercado
- Com o tempo, você começará a reconhecer padrões de eficiência sem o indicador
5. Aplicação Versátil
- Traders de tendência: Identificam quando as tendências estão fortes vs. exaustas
- Traders de faixa: Detectam zonas de consolidação com alto desperdício
- Traders de rompimento: Detectam rompimentos decisivos de alto volume vs. falsos rompimentos
- Traders de volume: Veem o volume no contexto do que foi alcançado
6. Sem Atraso
- Todos os cálculos são baseados em barras completas (ou barra atual em formação)
- Sem suavização, sem médias móveis, sem repintura
__________________________________________________________________________________________
DESAFIOS E PREOCUPAÇÕES
Antes de usar este indicador, entenda estas considerações importantes:
Este Indicador NÃO é para Todos:
1. Alta Complexidade
- Mais de 20 métricas em 8 grupos de colunas
- Requer entendimento de análise de volume, ação de preço e microestrutura de mercado
- Curva de aprendizado íngreme—espere 1-2 semanas de observação antes que os padrões fiquem claros
2. Sobrecarga de Informação
- Visualização padrão "mostrar tudo" é esmagadora
- Você deve personalizá-la para corresponder ao seu foco de negociação
- Paralisia de decisão é possível se tentar usar todas as métricas ao mesmo tempo
3. Não é um Sistema de Negociação
- Este indicador NÃO diz quando comprar ou vender
- Ele informa o que o mercado está fazendo, não o que VOCÊ deve fazer
- Você deve integrá-lo com suas próprias regras de entrada/saída
4. Requer Interpretação
- "Indecisão de alto volume" pode significar pré-rompimento OU exaustão
- "Movimento altista eficiente" não garante continuação
- Você precisa de contexto de mercado além do que o indicador mostra
5. Limitações de Volume
- Forex usa volume de ticks (contagem de transações), não volume real
- Instrumentos de baixa liquidez podem mostrar leituras erráticas de eficiência
- Eventos de notícias podem criar picos de volume que distorcem métricas temporariamente
6. Desempenho em Intervalos Menores
- Em gráficos de 1 minuto com mais de 100 barras visíveis, a interface pode ficar lenta
- Mais barras = mais cálculos por atualização
- Recomendado: Use gráficos de ≥5 minutos para monitoramento em tempo real
7. Sem Alertas
- Atualmente não gera alertas para condições específicas
- Você deve monitorar a exibição manualmente
8. Limiares Subjetivos
- Volume "alto" é definido como 1.25x da média—este é meu limiar pessoal
- Desperdício "extremo" é ≥80%—também subjetivo
- Você pode discordar dessas definições, mas estão codificadas
__________________________________________________________________________________________
COMO FUNCIONA
1. Coleta de Dados
- Define o período de análise (intervalo de data/hora)
- Para cada barra no período, coleta dados OHLCV das barras do gráfico
- Calcula métricas derivadas e de eficiência para cada barra
- Agrega métricas para estabelecer médias e extremos
2. Lógica de Interpretação
As avaliações em linguagem natural seguem uma matriz de decisão baseada em prioridades:
Prioridade 1: Padrões de Indecisão
- % desperdiçado extremo (≥80%) ou corpo pequeno com pavios altos → sinais de Doji/Rejeição
- Alto volume + desperdício extremo → Potencial exaustão
Prioridade 2: Cenários de Alto Volume
- Alto volume + alta eficiência + baixo desperdício → Impulso decisivo
- Alto volume + alta eficiência + alto desperdício → Rompimento com resistência
- Alto volume + baixa eficiência + alto desperdício → Movimento de absorção/contestado
Prioridade 3: Sinais Baseados em Eficiência
- Alta eficiência independentemente do volume → Movimentos limpos/eficientes
- Baixa eficiência → Deriva, moagem ou movimentos fracos
Prioridade 4: Retornos Baseados no Nível de Volume
- Baixo volume → Deriva, sem compromisso
- Volume médio → Avaliado por convicção, % do corpo, nível de desperdício
3. Refinamentos:
- Análise de pressão detecta contradições (ex.: "fechamento altista mas pressão de venda dominante")
- Análise de pavios identifica rejeição (pavios superiores em barras altistas = vendedores defenderam máximas)
- Contexto de tendência adiciona marcadores "[com tendência]" ou "[contra-tendência]"
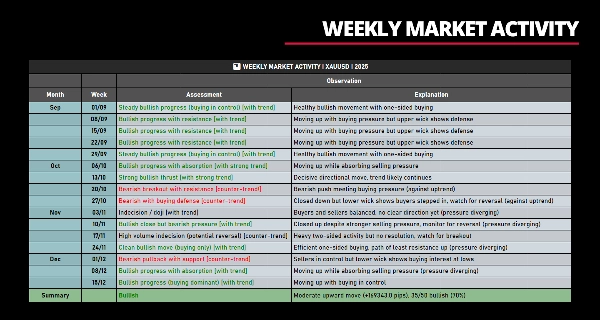
4. Cálculo Resumido
- Conta barras altistas vs. baixistas
- Calcula eficiência direcional (movimentos altistas vs. baixistas)
- Mede razões de absorção (quanto de resistência cada lado enfrentou)
- Calcula movimento líquido acumulado e contexto de tendência
- Gera viés unificado que combina contagem, magnitude e direção da tendência
__________________________________________________________________________________________
NOTAS TÉCNICAS
Método de Cálculo
- Usa análise cumulativa de barras dentro de cada período
- Soma volume, pavios, corpos de todas as sub-barras
- Calcula viés direcional líquido a partir dos dados cumulativos
- Mais preciso que análise simples de OHLC
Normalização
- Eficiência normalizada em relação ao min/máx no conjunto de dados visível
- Garante que as classificações sejam contextualmente apropriadas
- Escala de classificações: Extremo (80-100%) → Alto (60-80%) → Médio (40-60%) → Baixo (20-40%) → Mínimo (0-20%)
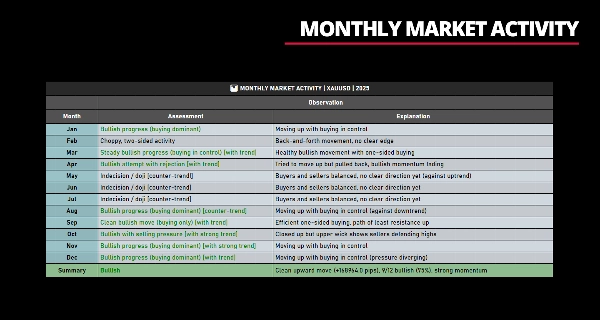
Contexto de Tendência
- Calcula pips líquidos acumulados em todos os períodos anteriores
- Identifica períodos direcionais consecutivos
- Compara eficiência e pressão recentes vs. anteriores
- Rótulos: "Tendência de alta (forte)", "Tendência de baixa (fraca)", "Lateralização"
__________________________________________________________________________________________
NOTA FINAL
Este indicador foi criado com a crença de que entender a qualidade do mercado é mais valioso do que prever a direção.
Em vez de perguntar "o preço vai subir?", ele pergunta:
- "Este movimento é de alta qualidade?"
- "Compradores/vendedores estão lutando ou eficientes?"
- "Este rompimento é sustentável ou fraco?"
- "As dinâmicas atuais estão alinhadas ou divergentes?"
Ao focar em qualidade em vez de previsão, os traders podem:
- Evitar configurações de baixa probabilidade
- Entrar em movimentos com compromisso por trás deles
- Sair quando o esforço exceder o resultado
- Entender quando ficar fora (ambiente de baixa qualidade)
Se você valoriza transparência, educação e compreensão do porquê o preço se move da forma que se move, este indicador pode ser valioso para você.
Se você prefere simplicidade e sinais rápidos, outras ferramentas servirão melhor.
__________________________________________________________________________________________
MAIS INDICADORES GRATUITOS
Explore uma ampla gama de ferramentas de análise de mercado—desde estrutura e volume até regressão, volatilidade e intervalos de tempo personalizados.
O código-fonte está disponível no repositório do GitHub repository.
Todos gratuitos para uso. Mas se quiser enviar um apoio para café, pode fazê-lo aqui.
Suporte/Resistência
Volume
- Volume Activity Profiler
- Volume Efficiency Analyzer
- Volume Profile Analytics
- Volume Profile - Updated
- Volume Spread Analysis
- VWAP (Volume Weighted Average Price)
Médias Móveis
- SSL Channel
- Anchored Moving Average
- Deviation-Scaled Moving Average
- Gann High Low Activator
- Instantaneous Trendline
- Kaufman Adaptive MA with Trend Vision
- Moving Average Channel
- Moving Averages Suite
- Trend Channel Moving Average
Utilitários/Personalizados
Baseado em Regressão
Volatilidade
Osciladores
__________________________________________________________________________________________
AVISO LEGAL
Negociar envolve riscos. Este indicador é destinado apenas para análise técnica — sempre aplique gestão de risco adequada e negocie com responsabilidade.
FEEDBACK E MELHORIAS
Se você tiver sugestões, pedidos de recursos ou ideias para melhorias, por favor deixe um comentário na aba Discussão. Seu feedback ajuda a melhorar o indicador para todos.
Resumo
Key features include customizable column groups, color highlighting, and time zone adjustments for various trading sessions. The indicator quantifies market conditions by identifying efficient versus inefficient moves, absorption levels, and directional pressure, helping traders distinguish between decisive, exhausted, or indecisive price actions after they occur. It incorporates trend context and natural language interpretations to aid understanding of market dynamics.
Volume Efficiency Analyzer does not generate buy/sell signals or alerts; it is intended to complement traders’ own strategies by providing objective metrics that quantify market quality rather than predict direction. It requires familiarity with volume analysis and market microstructure due to its complexity and information density. The indicator is suitable for trend, range, breakout, and volume-focused traders seeking a comprehensive, multi-dimensional view of market behavior.
Avaliações de clientes
5 | 100 % | |
4 | 0 % | |
3 | 0 % | |
2 | 0 % | |
1 | 0 % |


