
Beschreibung
Müde davon, ewig damit zu verbringen, Ihre Charts zu markieren? Dieser Indikator erledigt das für Sie super schnell.
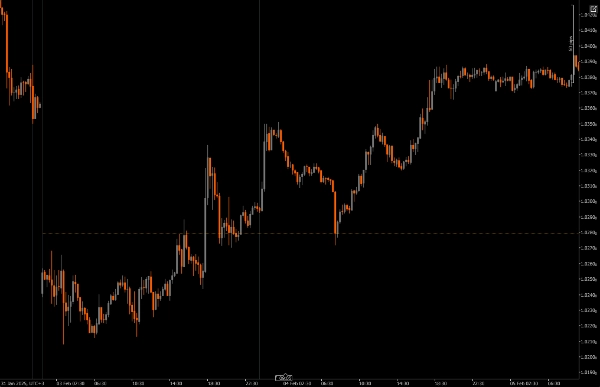
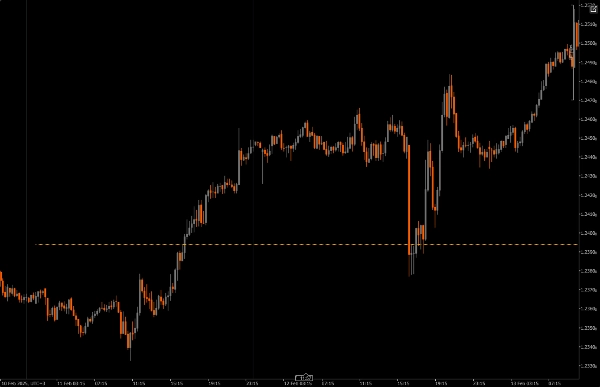
Er findet den Mittelpunkt zwischen dem Hoch und Tief des Vortages und zeichnet ihn in Ihre Charts ein. Jetzt können Sie Ihre Charts super schnell scannen. Ganz einfach!
Einige coole Funktionen
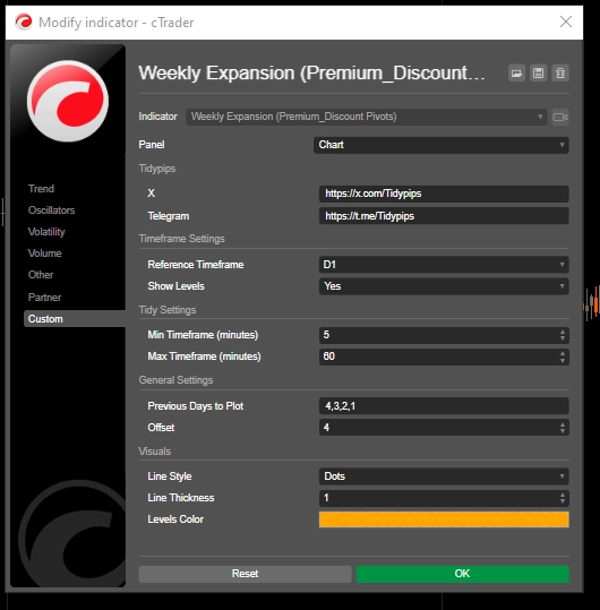
Anpassbarer Referenzzeitrahmen: Sie können einen Mindest- und Höchstzeitrahmen wählen, um bedeutende Preisniveaus darzustellen, was Ihnen hilft, Ihre Intraday-Trades mit breiteren Markttrends in Einklang zu bringen.
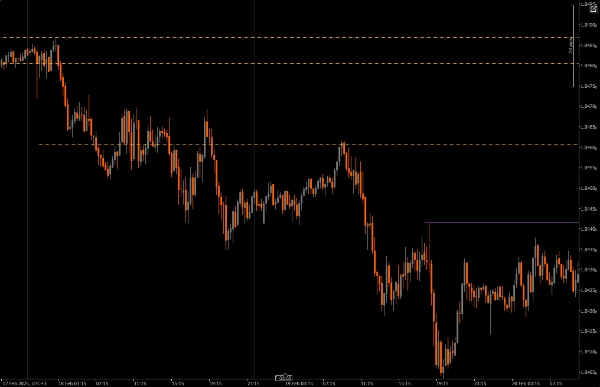
Was diesen Indikator besonders macht, ist die Fähigkeit, der Wochenkerze zu folgen, während sie Tag für Tag entsteht, was es einfacher macht, die Ausdehnung der Wochenkerze zu erfassen.
Offset-Parameter: Diese Funktion ermöglicht es Ihnen zu entscheiden, wie weit in die Zukunft die dargestellten Niveaus reichen, sodass Sie ein klareres Bild potenzieller zukünftiger Preisfortsetzungszonen erhalten.
Visuelle Anpassung: Sie haben viele Optionen, um Linienarten, Dicke und Farben anzupassen, sodass Sie leicht ein Chart erstellen können, das Ihrem persönlichen Stil entspricht und gut lesbar ist.
Zeitrahmenbeschränkungen: Der Indikator enthält Prüfungen, um sicherzustellen, dass er nur innerhalb Ihrer angegebenen Zeitrahmeneinstellungen funktioniert, sodass Sie Chart-Unordnung vermeiden können, wenn Sie durch andere Zeitrahmen wechseln.
Zu beachten:
Ein persönlicher Favorit
Sind Sie wie ich und können nicht von Lippenstift auf Ihren Charts lassen, dann probieren Sie diesen Indikator. Er verfügt über Zeitrahmenbeschränkungen und eine Lookback-Perioden-Funktionalität, die darauf abzielt, Chart-Unordnung zu reduzieren.
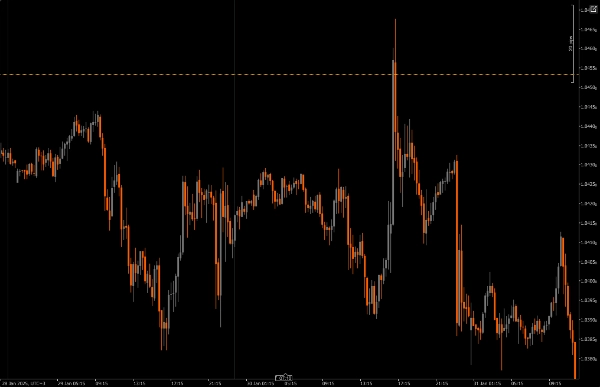
Dieser Indikator ist nützlich, um zu verfolgen, wie sich die Wochenkerze entwickelt; Wenn die wöchentliche Ausdehnung Anzeichen eines bullischen Orderflows zeigt, visualisieren die Pivot-Level dieses Indikators Bereiche oder Zonen, um sich der bullischen Ausdehnung anzuschließen. Ebenso, wenn die wöchentliche Ausdehnung einen bärischen Orderflow zeigt, visualisieren die Pivot-Level dieses Indikators Bereiche oder Zonen, um sich der bärischen Ausdehnung anzuschließen.
Installation: Beginnen Sie mit dem Herunterladen und Installieren des Previous Day Equilibrium auf Ihrer cAlgo-Plattform.
Einrichtung: Öffnen Sie die Einstellungen, um Ihren Referenzzeitrahmen auszuwählen, entscheiden Sie, wie viele vorherige Tage Sie darstellen möchten, und passen Sie die visuellen Einstellungen nach Ihren Wünschen an.
Analyse: Beobachten Sie beim Trading die dargestellten Niveaus in Ihrem Chart. Diese Niveaus zeigen an, wo der Preis basierend auf historischen Kursbewegungen möglicherweise umkehren könnte, was Ihnen hilft, fundiertere Entscheidungen zu treffen.
Ausführung: Verwenden Sie diese Niveaus, um Ihre Ein- und Ausstiegspunkte sowie Stop-Loss- und Take-Profit-Orders zu bestimmen und integrieren Sie sie in Ihre gesamte Handelsstrategie.
Empfohlene Begleitwerkzeuge:
cTrader: Dies ist die beste Plattform für die Verwendung des Previous Day Equilibrium und bietet eine reibungslose Erfahrung bei Anpassung und Analyse.
Technische Analysetools: Kombinieren Sie diesen Indikator mit anderen Werkzeugen wie gleitenden Durchschnitten oder Oszillatoren, um einen umfassenderen Überblick über Markttrends zu erhalten.
Risikomanagement-Tools: Nutzen Sie Rechner und Stop-Loss-Werkzeuge, um Ihr Risiko beim Trading um diese Schlüsselbereiche effektiv zu steuern.
Durch die Verwendung des Previous Day Equilibrium zusammen mit diesen Werkzeugen können Sie Ihre Handelsstrategie verbessern und Ihre Erfolgschancen in der schnelllebigen Welt des Intraday-Handels erhöhen.
Zusammenfassung
Kundenbewertungen
5 | 0 % | |
4 | 100 % | |
3 | 0 % | |
2 | 0 % | |
1 | 0 % |


