
说明
SR COMMANDER — 多时间框架版
看看大资金划定的界限。在你的时间框架内交易。用他们的思维方式思考。
大多数支撑和阻力工具都绑定在你的图表时间框架上。如果你在M1上做剥头皮交易,你的支撑/阻力水平来自M1蜡烛——小而嘈杂,且容易被伪造。SR Commander MTF打破了这种限制。
将你的图表设置为M1。将你的支撑阻力时间框架设置为H1。现在你用一分钟图的精度进行剥头皮交易,但你的支撑和阻力水平是从机构、算法和专业交易者实际做出决策的小时蜡烛中绘制的。这就是优势所在。
多时间框架引擎的工作原理
该指标同时运行两个独立的数据流。
你的 图表时间框架 控制你所看到的内容——你的蜡烛、你的入场点、你的箭头、你的时机。你的 支撑阻力时间框架 控制水平线的来源。这两个数据流实时逐根K线映射。当新的图表蜡烛收盘时,SR Commander会查找该时刻对应的正确支撑阻力时间框架蜡烛,并根据该更高时间框架的结构重新计算水平线。
这意味着你的绿色支撑线和红色阻力线始终反映你选择的支撑阻力时间框架的波动率加权结构——而非你正在观看的图表的噪音。
水平线背后的科学
SR Commander不仅仅是在波峰和波谷处画线。它使用了 Yang-Zhang波动率模型——这是专业量化研究中使用的同类波动率估计器——来计算每根蜡烛的真实统计权重。每个水平线都来源于归一化的价格结构,考虑了隔夜跳空、开盘到收盘的移动以及蜡烛内的波动范围。结果是具有真正数学意义的水平线,而不仅仅是视觉上的突出。
你在图表上看到的内容
- 🟢 绿色支撑线 — 当前价格下方最近的统计显著支撑,来源于你选择的支撑阻力时间框架
- 🔴 红色阻力线 — 当前价格上方最近的统计显著阻力,来源于你选择的支撑阻力时间框架
- ⬆️ 买入信号 — 当价格从支撑反弹且支撑阻力时间框架蜡烛确认看涨收盘时触发
- ⬇️ 卖出信号 — 当价格拒绝阻力且支撑阻力时间框架蜡烛确认看跌收盘时触发
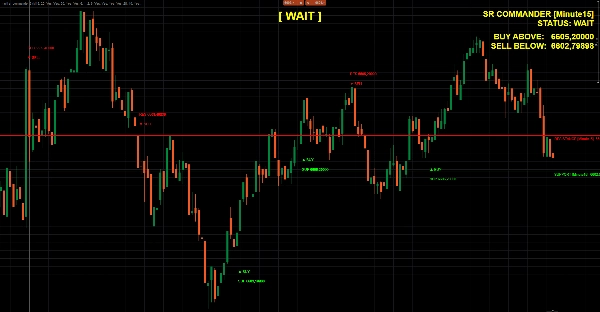
- 📊 实时仪表盘 — 显示当前支撑阻力时间框架、当前状态和精确的突破触发价格
- 🔵 大状态标签 — 买入 / 卖出 / 等待,每根K线更新,显示在图表顶部中央
- 🕓 历史叠加 — 在图表上标记反弹、拒绝、突破和跌破,便于即时视觉验证
有效的时间框架组合
图表时间 支撑阻力时间框架 用例
M1
M5 或 M15
快速剥头皮,短期结构
M5
H1
日内交易,使用小时级别
M15
H4
波段入场,4小时结构
H1
D1
基于日线支撑阻力的持仓交易
任意
图表
经典模式——原始单时间框架行为
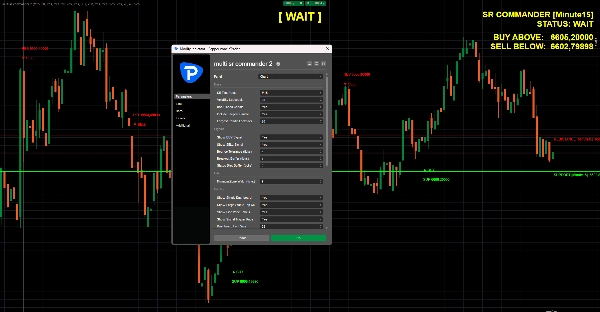
功能特点
- 完整多时间框架引擎——任意支撑阻力时间框架配合任意图表时间框架
- Yang-Zhang波动率归一化水平线计算
- 最大蜡烛包含——始终捕捉回溯期内的主导结构蜡烛
- 反弹和拒绝信号逻辑,带可配置的容差和缓冲
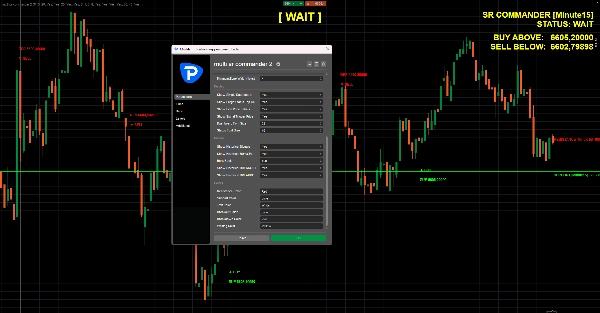
- 突破和跌破检测,带可调节缓冲
- 历史信号叠加,便于即时基于图表的验证
- 仪表盘和大状态标签,字体大小和颜色完全可定制
- 零重绘——所有信号基于收盘蜡烛,当确认模式激活时
适合谁使用?
理解最佳入场点存在于较低时间框架,而最佳水平线存在于较高时间框架的交易者。如果你曾在交易M5时手动绘制H4水平线——SR Commander自动化了整个过程,使其数学上有据可依,并在价格反应的瞬间将信号直接显示在你的图表上。
更高时间框架结构。更低时间框架精度。一个指标。
摘要
The indicator calculates S/R levels using the Yang-Zhang volatility model, which accounts for overnight gaps, open-to-close movement, and intrabar range to produce statistically significant levels rather than simple swing highs and lows. On the chart, it shows a green support line and a red resistance line representing the nearest significant levels below and above the current price from the chosen S/R timeframe.
Additional features include buy and sell signals triggered by price reactions to these levels confirmed on the S/R timeframe, a live dashboard displaying current status and breakout prices, a large status label indicating BUY, SELL, or WAIT, and historical overlays marking past bounces, rejections, and breakouts. The indicator supports various timeframe combinations suitable for scalping, intraday, swing, and position trading across markets including forex, indices, commodities, stocks, and crypto.
客户评价
5 | 50 % | |
4 | 50 % | |
3 | 0 % | |
2 | 0 % | |
1 | 0 % |


