
说明
振幅动量标签 — 由波动性驱动的自适应趋势检测
振幅动量标签器融合了多个先进概念:
- 状态检测 — 识别真实的趋势阶段
- 波动性适应 — 自我调整以适应当前市场状况
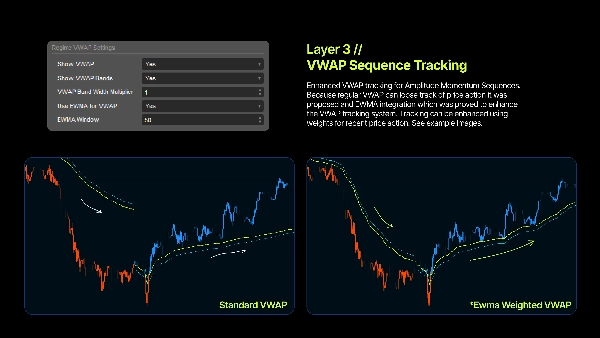
- 动态VWAP — 突出显示有意义的回调和延续水平
- 滚动价差估算器 — 在趋势中发出最佳再入点信号
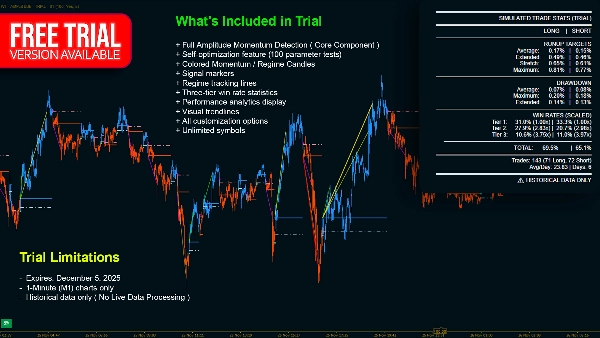
- 优化模块 — 具备自我优化功能**
这创建了一个智能、自我调整的指标,提供清晰性、适应性和可操作的交易区域——无需不断手动调整。
它是什么?
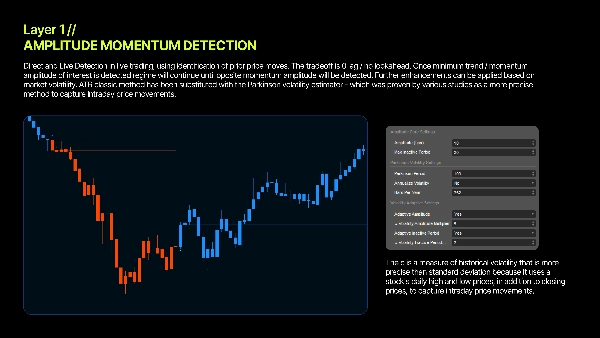
振幅动量标签器是一个 状态检测指标,能够实时准确定位市场进入或退出上升或下降动量阶段——实时。
与传统的移动平均交叉不同,它通过评估价格位移和反转强度来衡量实际动量变化。
核心问题
市场当前处于动量阶段吗?方向是哪个?
为回答此问题,指标跟踪:
- 振幅 — 价格移动的距离;
- 序列 — 高点和低点出现的顺序。
强劲的移动后紧跟有意义的反转,标志着新动量状态的开始。
工作原理
1. 测量摆动
指标不断更新最高和最低价格极值。
它们的差值——振幅——定义了市场当前的摆动幅度。
2. 识别反转
- 急剧下跌后紧跟强劲反弹 → **上升动量**
- 急剧上涨后紧跟强劲下跌 → **下降动量**
3. 确认重要性
只有超过波动性调整阈值的反转才会触发有效信号。
4. 识别疲劳
如果价格停止推进,指标识别动量疲劳并返回中性状态。
帕金森波动率 — 自适应阈值
大多数指标使用固定参数。本指标自动适应。通过使用帕金森波动率——结合盘中高低价范围——指标根据真实市场状况调整灵敏度。结果是在安静和波动环境中均表现稳定。(统计证明比ATR方法更高效)
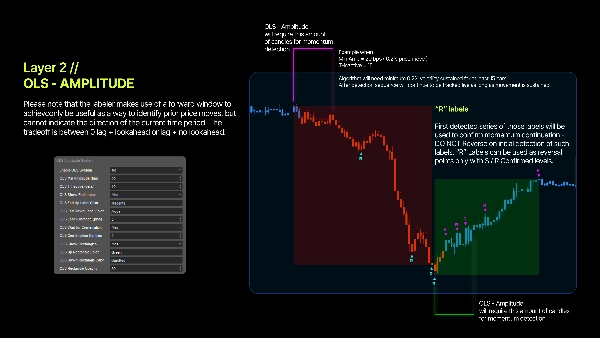
状态VWAP — 再入的动态水平
一旦状态激活,指标计算该趋势特定的VWAP,提供动态支撑和动态阻力水平。机构高度依赖VWAP,价格常围绕其反应——使其成为回调入场的理想选择。
EWMA模式
启用EWMA以更重视近期价格,创建更平滑、更灵敏的VWAP曲线。非常适合识别延续趋势中的再入点。
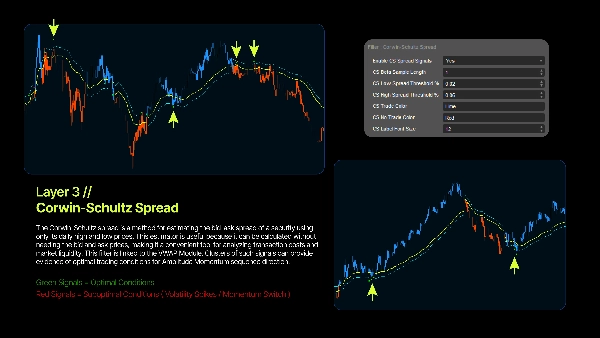
滚动价差估算器 - 再入的动态过滤器
滚动价差估算器是一种通过观察交易价格估算买卖价差的方法,通常使用价格变动的序列协方差。由Roll开发,假设连续交易在买价和卖价之间交替,且新信息不会持续推动“真实”价格。虽然方法简单且基础,但原始方法已被改进以解决向下偏差和某些数据集表现不佳的问题。该估算器基于如果没有新信息发布,价格将仅在买卖价之间波动的理念。它假设买入发起和卖出发起交易的概率相等。
使用优势
1. 客观趋势识别 - 无需趋势线。无需猜测。数学定义状态。
2. 波动性自适应 - 使用帕金森波动率自动调整以适应变化条件。
3. 清晰入场区 - 状态VWAP水平帮助精准定位直观的回调和加仓区域。
4. 明确状态边界 - 精确知道动量何时开始及结束。
5. 多时间框架兼容 - 基点归一化确保任何图表上的一致表现。
量化基础
对数收益率
使用对数收益率确保对称性,使动量测量在数学上更稳健。
基点
所有计算均使用标准化的基点单位(1基点 = 0.01%),实现跨资产一致性。
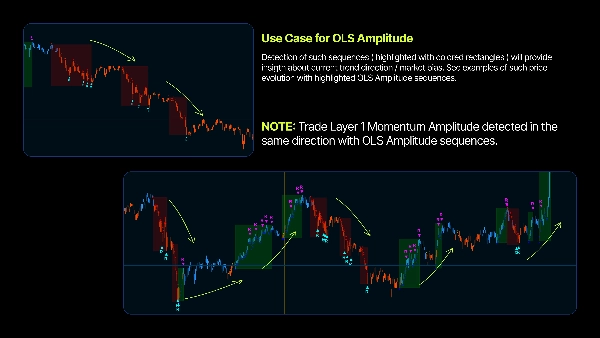
回撤检测
通过强烈的方向性移动后跟随有意义的反向移动(V形反转)来识别动量变化。
合成成交量
基于区间和实体的合成成交量确保任何标的的VWAP准确性。
⎽⎽⎽⎽⎽⎽⎽⎽⎽⎽⎽⎽⎽⎽⎽⎽⎽⎽⎽⎽⎽⎽⎽⎽⎽⎽⎽⎽⎽⎽⎽⎽⎽⎽⎽⎽⎽⎽⎽⎽⎽⎽⎽⎽⎽⎽⎽⎽⎽⎽⎽⎽⎽⎽⎽⎽⎽⎽⎽⎽⎽⎽⎽⎽⎽⎽⎽⎽⎽⎽⎽⎽⎽⎽⎽⎽⎽⎽⎽⎽⎽⎽⎽⎽⎽⎽⎽⎽⎽⎽⎽⎽⎽⎽⎽⎽⎽⎽⎽⎽⎽⎽⎽⎽⎽⎽⎽⎽⎽⎽⎽⎽
此工具仅供教育和信息参考之用,不构成投资建议。交易存在风险,亏损可能超过存款。过去表现不保证未来结果。您对所有交易决策负全责。创作者不对因使用该指标产生的任何财务损失负责。交易前请务必自行进行分析。
摘要
Key features include:
- **Regime Detection:** Pinpoints market entry and exit points for momentum trends.
- **Volatility Adaptation:** Uses Parkinson Volatility to self-tune sensitivity based on current market conditions, ensuring consistent performance across varying volatility.
- **Dynamic VWAP:** Calculates a volume-weighted average price specific to each trend regime, providing dynamic support and resistance levels for pullback and continuation entries.
- **Roll Spread Estimator:** Estimates bid-ask spreads to signal optimal re-entry points during trends.
- **Self-Optimization Module:** Automatically adjusts parameters without manual intervention.
The indicator operates by continuously tracking price extremes to measure swing amplitude, detecting significant reversals that exceed volatility-adjusted thresholds, and identifying momentum exhaustion when price progression stalls. It uses logarithmic returns and basis-point normalization for mathematically robust, cross-asset consistency. Synthetic volume calculations enhance VWAP accuracy across symbols.
This tool supports multiple markets including Forex, stocks, indices, commodities, and cryptocurrencies, and is compatible with various timeframes. It outputs visual signals and filters to assist traders in objective trend identification and clear entry zone determination.
客户评价
5 | 75 % | |
4 | 25 % | |
3 | 0 % | |
2 | 0 % | |
1 | 0 % |


!["[Hamster-Coder] Pivot Points MTF" 标识](https://cdn.ctrader.com/image/webp/4c143e5a-309c-40e3-a578-f04d1e133ffa_31159)


!["Smart Money Concepts (SMC) [Iridio Capital]" 标识](https://cdn.ctrader.com/image/webp/28b69fd1-ef54-4bed-9487-07e78e883be4_40934)


