Trading product for wt.Trend-Reversal Charts 桌面插件 Chart UI Tools, image 1
桌面插件
版本 1.0, Jun 2026
Windows 版、Mac 版
Trading product for wt.Trend-Reversal Charts 桌面插件 Chart UI Tools, image 2
88.59M
交易量
105.61K
盈利点数
72
销售
445
免费安装

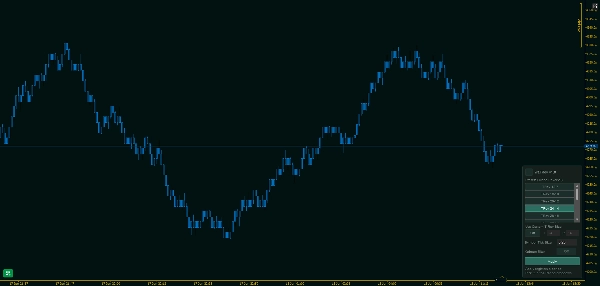
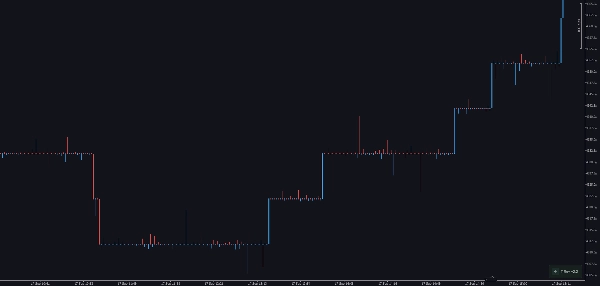
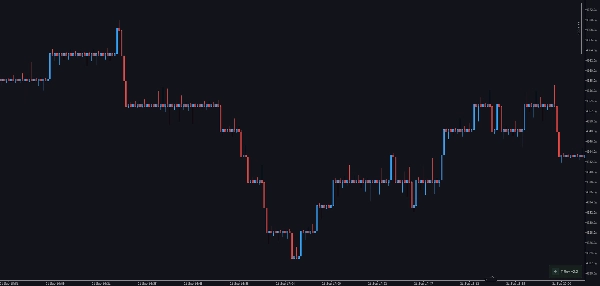
Trend Reversal (TRev) charts plot candlesticks according to the distance price moves, not the passage of time.

In this sense they are related to Point & Figure (P&F) charts — but where a single P&F column represents an entire trend until price reverses, a TRev chart shows a continuing trend as a series of candles.

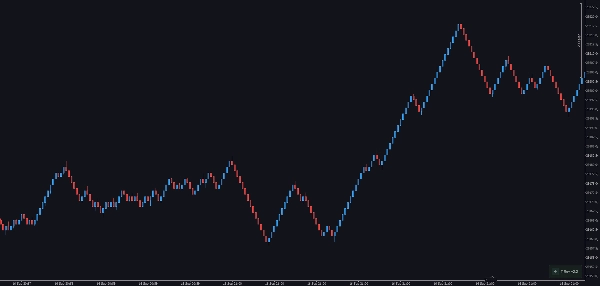
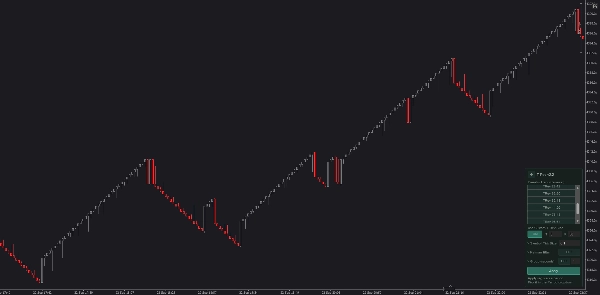
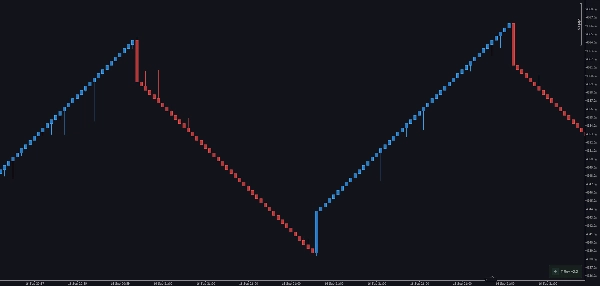
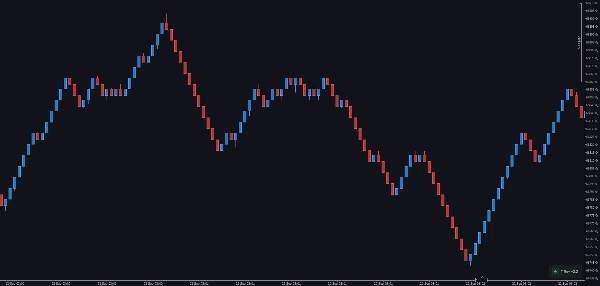
This is because in a TRev chart a new candle forms every time price moves a set number of ticks in any direction — so an extended move prints multiple trending candles one after another, giving you a much finer view of how a trend develops.


For usage guide of plugin and the On-chart Panel - please refer to "Custom Timeframes Plugin" Video Presentation, as it follows the same usage / methods.


Trending and Reversal Candles

Like P&F charts, TRev charts contain two kinds of candles.

  1. Reversal candles form the same way as in a P&F chart: a new candle is plotted when price moves a set number of ticks against the current direction (the reversal size).
  2. Trending candles are where TRev differs from P&F: a new trending candle forms every time price continues in the same direction for a set number of ticks (the trend size).

You configure two values — the trend size and the reversal size. By convention the trend size is roughly 1,68 × the reversal size, though you are free to use any ratio.

Example:
Say you set a reversal size of 500 ticks, giving a trend size of 840 (500 × 1,68 ≈ 840):
Price is moving up, then reverses by 500 ticks → a new reversal candle is plotted.
Price instead continues up by 840 ticks → a new trending candle is plotted.


Why TRev candles only have a wick on one side

Look at a TRev chart and you'll notice each candle has a wick only on its opening side. This falls directly out of how the candles are built. Take a green (up) candle. In a normal time-based candle, an open-side wick means price dropped below the open, and a close-side wick means price rose above the close. On a TRev green candle:

An open-side wick can form — it means price dipped, but not by the full reversal size (e.g. 500 ticks) needed to start a new reversal candle. A close-side wick cannot form — the candle only closes once price has travelled the trend size (e.g. 840 ticks) from the open. Price can't overshoot and come back within the same candle, because the moment it reaches 840 ticks, a new trending candle begins. Red (down) candles follow the same rule mirrored: the wick sits on the open (upper) side, and the low is the close.


Choosing a TRev Chart in the Plugin

This plugin adds TRev periods to cTrader's normal Period dropdown, and gives you an on-chart control panel to create them. In both the period name and the panel, the first number is the trend size and the second number is the reversal size — e.g. 16-10 means trend 16, reversal 10.

Each period name encodes everything that defines the bars, in the form:

[symbol:]{trend}-{reversal} - {tick size} - {K|O}

where K = Kalman filter active and O = Original (raw, Kalman off). For example, XAU:16-10 - 0.25 - K is a Kalman TRev on XAU, trend 16, reversal 10, tick size 0.25.


You can set the rotational period of a TRev candle in two ways:

  1. Pick a preset. The panel lists the standard trend-reversal pairs in a scrollable list. With the Use Custom T-Rev Size toggle set to Off, the highlighted preset is used.
  2. Enter custom ranges. Set the Use Custom T-Rev Size toggle to On and type your own Trend (T) and Reversal (R) values on the same line.

Either way, press Apply to register the period. It then appears in cTrader's Period dropdown, ready to select.


Available presets

The built-in presets (trend-reversal) are: 12 - 7 // 16 - 10 // 20 - 12 // 24 - 14 // 28 - 16 // 28 - 14 // 28 - 12 // 32 - 20 // 32 - 18 // 44 - 26 // 78 - 48 // 96 - 64 // 120 - 82 // 210 - 125


Additional options

Symbol Tick Size — the tick size used for all threshold math, set directly in the panel. This value is always applied, so the trend and reversal distances are measured in consistent price increments regardless of the instrument's native tick. It is part of the period name.


Kalman filter (Off/On) — an optional price denoiser. When on, the raw price is smoothed before the trend/reversal threshold is tested, so single-tick spikes don't prematurely close a candle. The candle's OHLC always tracks the raw price; only the timing of when a candle closes is affected. In the period name, Kalman-on is marked K and Kalman-off is marked O (Original), so the two are distinct periods you can run side by side.

Break at EOD — optionally restart candle formation at the start of each new trading day.


Benefits of TRev Charts

Like P&F charts, TRev charts make it easy to see where price ranges for a meaningful amount of time. By stripping out the noise of minor, time-based fluctuations, they make trends and reversals far more obvious.

When you see a cluster of reversal candles following one another, it marks a choppy area in the market — a sign of absorption or distribution. These zones stand out clearly on a TRev chart, which makes identifying support and resistance more straightforward.


Absorption refers to price levels where a large volume trades on both the buy and sell side without price moving substantially — essentially where market participants meet and do most of their trading without pushing the market, leaving both buyers and sellers filled.
插件配置
插件类别
实用工具
数据访问
市场数据
头寸
订单
图表
历史
支持的订单类型
市价单
限价单
止损单
止损限价单
0.0
评价:0
客户评价
该产品尚无评价。已经试过了?抢先告诉其他人!
Chart UI Tools
cTrader Store 提供的所有产品,包括交易机器人、指标和插件,均由第三方开发者提供,仅供信息参考和技术访问之用。cTrader Store 并非经纪商,不提供投资建议、个人推荐或任何未来业绩保证。

该作者的其他作品

指标
Prop
Forex
+12
Lightweight Risk-Reward Visualization Tool.
桌面插件
Forex
Crypto
+3
Build custom second and tick charts using adjustable bar sampling intervals.
桌面插件
Stocks
Indices
+1
Build custom charts based on specific trading sessions.
cBot
Fixed Risk %
No Overtrading
+5
Turn Your Keyboard into a Trading Console — Instant Entries, Exits, and Precision Risk Control.
指标
Forex
Crypto
+5
Experience a new approach with amplitude-based momentum analysis. Smart Trend Detection That Adapts to Market Volatility
桌面插件
Forex
Signal
+2
Adaptive Renko chart builder for precise, flexible trading - ideal for both scalping and trend analysis.
指标
Key Levels
Supertrend
+1
A cTrader indicator for clear trend direction, entry timing, and on-chart risk visualization.
指标
Imbalance
Key Levels
+2
A Next-Generation Adaptive Oscillator with Z-Score Regime Engine.
指标
Forex
Crypto
+5
This indicator combines two independent analytical engines into a single overlay on your chart.
指标
Imbalance
Order Block
+5
Spot the moments when price and order flow disagree - across every timeframe, at a glance.
指标
Forex
Crypto
+5
Combines multiple Currency Pairs / Symbols into a single Weighted Average Strength of that currency.
指标
Prop
Forex
+5
A channel-based trend indicator that combines three distinct analytical layers into a single, readable overlay.

猜您喜欢

桌面插件
Forex
Crypto
+2
Get TradingView charts & heatmaps directly in cTrader!
桌面插件
ATR
RSI
+24
One-click toggle for Positions / Pending Orders on cTrader charts with fixed on-chart warnings and an ASP control panel
桌面插件
Signal
Breakout
The Risk-Reward plugin is a tool to visualize a trading idea based on other analysis tools,
桌面插件
Forex
Signal
+2
Adaptive Renko chart builder for precise, flexible trading - ideal for both scalping and trend analysis.
桌面插件
Prop
Forex
+5
Place professional OCO & OSO orders in cTrader — visually, instantly, and without execution mistakes.
桌面插件
Forex
Commodities
Close all non crypto trades at 19:55 utc Friday
桌面插件
ATR
Prop
+5
cTrader risk management plugin with daily & total drawdown limits, CBot control, and risk-based order execution.
88.59M
交易量
105.61K
盈利点数
72
销售
445
免费安装