Description
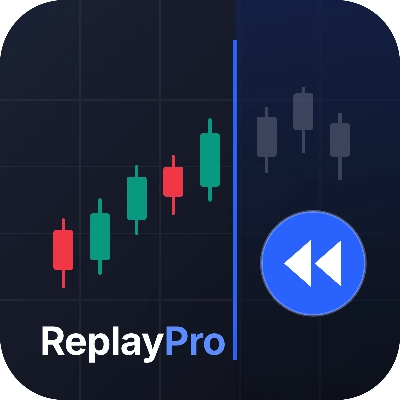
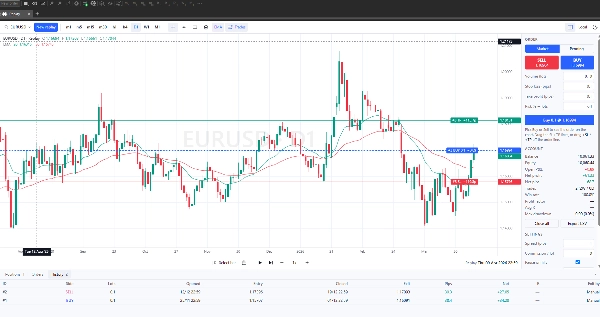
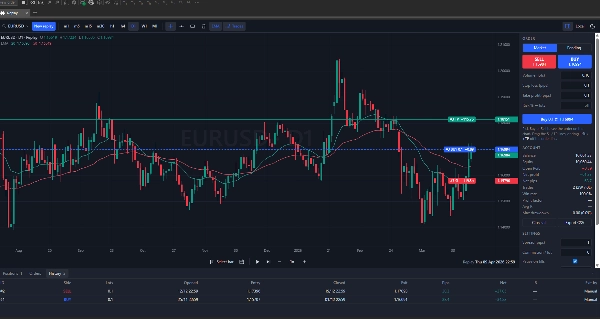
Practise on real market history, without hindsight. ReplayPro replays your broker’s charts candle by candle inside cTrader. Future bars stay hidden until you step or play, so every decision is made the way you make it live, with only the past on your screen. Test a setup on many past days in one sitting, rehearse your entries and exits, and build screen time far faster than waiting for live markets.
Getting started in one minute
- After installing, start ReplayPro in Settings → Plugins (or Algo → Plugins). No permission prompt appears.
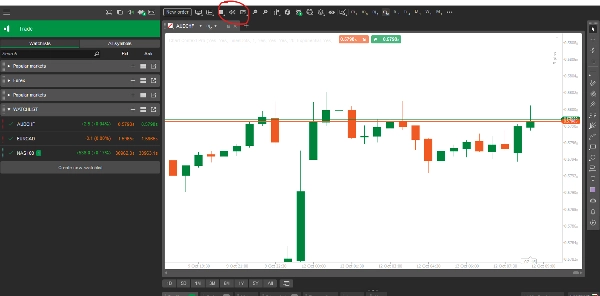
- Open any chart and click the Replay button (⏪) in the chart toolbar. A Replay tab opens with the Start a replay dialog.
- The symbol of your chart is already selected; click it to search for another one. Choose a timeframe and a start date and time.
- Click Start replay. The first replay of a symbol loads its history with a progress bar; later replays start instantly.
- Press Play or Space to replay, or the right arrow to step one candle at a time. Use Preview Buy or Preview Sell, then Place, to practise a trade.
Why traders choose ReplayPro
- Your broker’s prices, inside cTrader. No separate app and no extra data subscription. Replays use your broker’s own history, and daily, weekly and monthly candles come from your broker’s own series, so they match your live cTrader charts.
- Go back whenever you want. Click any candle with Select bar to restart from it, or jump to any date, backwards or forwards. History is cached on your computer after the first load, so restarts inside it are instant, even after restarting cTrader.
- Real multi-timeframe reading. Switch between m1, m5, m15, m30, h1, h4, D1, W1 and monthly in the middle of a replay. The chart stays at the same moment, the current candle is shown partly formed exactly as it was then, and your scroll position is kept.
- Fills you can trust at any speed. Every one-minute bar is checked for entries, stops and targets, even at 100x. If a stop and a target are both reached inside the same minute, the stop counts first. Gaps fill at the open price; longs close on the bid and shorts on the ask.
- A trade ticket made for practice. Drag stop loss and take profit on the chart before you place the order, size positions by risk percentage, and let playback pause automatically when an order fills or a stop or target is hit.
- Know your numbers. Win rate, profit factor, average R, net pips, net profit and maximum drawdown update with every trade. Export your trade history to CSV for your journal.
- Several replays at once. Each click on the toolbar button opens another replay window, for example EURUSD and gold on different dates. Windows share downloaded history.
- Zero risk to your account. ReplayPro never sends orders to your broker and runs without any special permissions. Every trade in the replay window is simulated.
Replay controls
- Play, pause and step one candle at a time, at speeds from 0.1x to 100x, adjustable while playing.
- Jump to a date, Select bar, and a replay bar at the bottom or top of the chart.
- Searchable symbol list with your recent symbols. Switch symbol mid-replay at the same date and time.
- Keyboard: Space to play or pause, the right arrow to step, + and − for speed.
Chart and analysis
- 33 built-in indicators: SMA, EMA, WMA, Hull MA, Supertrend, Parabolic SAR, Ichimoku, Alligator, Fractals, ZigZag, Bollinger Bands, Keltner and Donchian channels, Pivot Points, VWAP, RSI, MACD, Stochastic, CCI, Williams %R, Momentum, ADX, Aroon, Awesome Oscillator, Price ROC, TRIX, ATR, Standard Deviation, Volume, OBV, MFI, Chaikin Money Flow and A/D. They are calculated only from candles already revealed. Oscillators open in their own resizable panels, and one indicator set applies to every symbol.
- Horizontal lines and rectangles for zones, saved per symbol and kept across timeframes.
- Zoom, pan, crosshair, light and dark themes, local time or UTC. Hide your trade lines with one click for a clean chart.
Made for
- Backtesting a manual strategy over months or years of history in an afternoon.
- Practising a session, such as the London or New York open, on many different days.
- Preparing for a prop-firm challenge: practise your risk per trade and drawdown limits before you pay for one.
- Training pattern recognition without hindsight.
- Replaying a day you traded live to practise better trade management.
How it works
ReplayPro loads one-minute (M1) history from your broker and builds m5 to h4 candles from it, so timeframe switches are instant. The first replay of a symbol downloads M1 back to 90 days before your start date, with a progress bar and a Cancel button. The result is cached on your computer month by month, and later sessions only fetch newer bars.
Good to know
- Custom and third-party cTrader indicators can’t be added to the replay chart; the 33 built-in indicators are available.
- Fills are simulated on one-minute bars with a fixed spread: the live spread while the market is open, the last one used for that symbol, or your own value. It is not a tick-by-tick simulation.
- How far back you can replay depends on how much M1 history your broker provides. A start date several years back can take a few minutes to load the first time.
- Profit in account currency uses today’s pip value, so for cross pairs on old dates it is approximate. Pips and R are exact.
- Tested on cTrader for Windows.
Disclaimer: ReplayPro is a training and analysis tool. Results achieved in replay are simulated and are not real trading results. Trading involves risk. Past performance does not guarantee future results.