Description
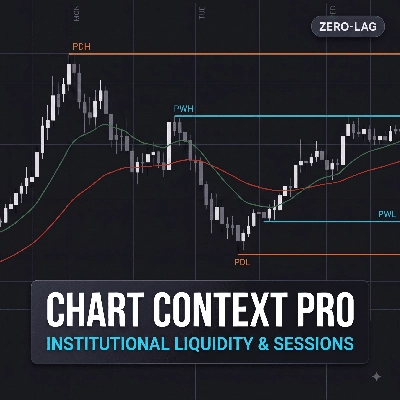
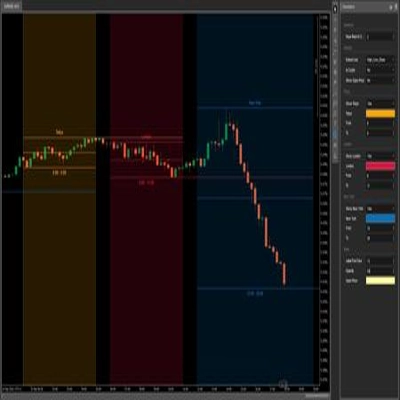
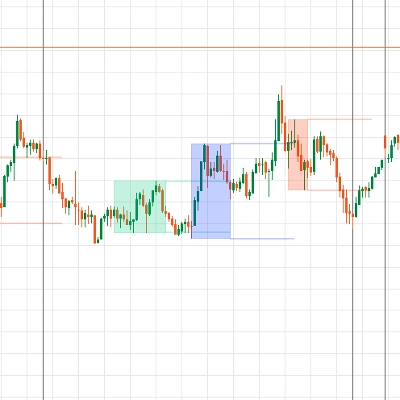
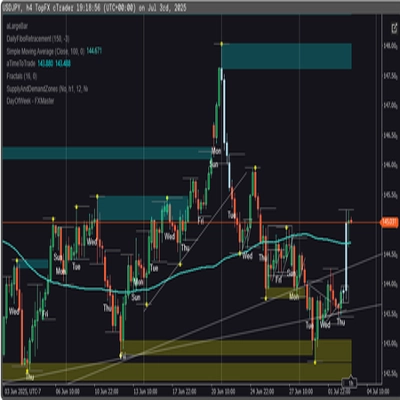
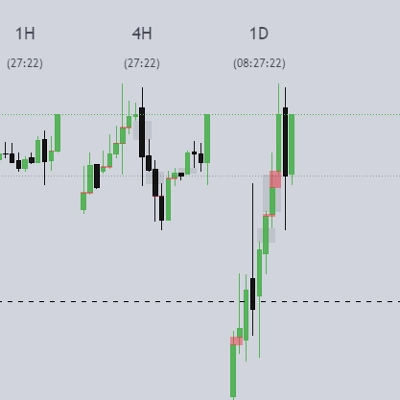
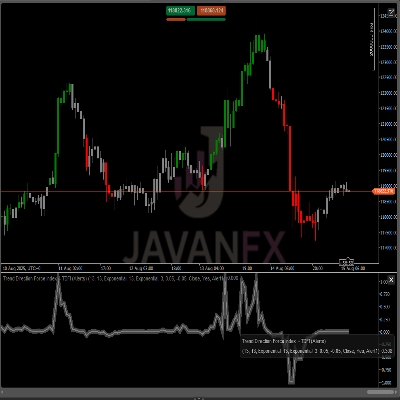
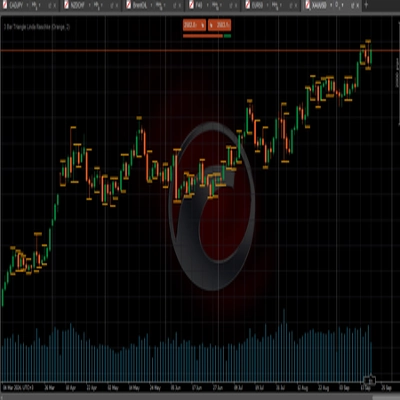
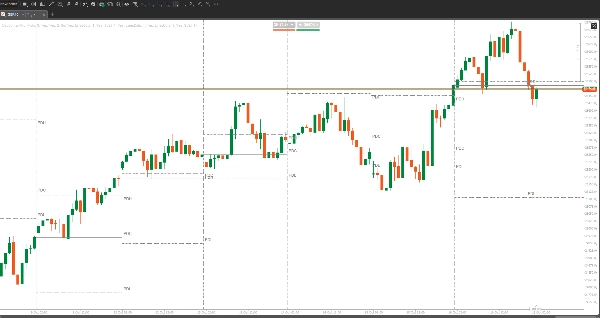
DayContextPro gives intraday charts a clean daily structure. It marks where each trading day and week begins, and carries the previous day’s high, low and close into the next day. These lines are drawn for every day in the chart’s history, not just today, so you can scroll back and see how price reacted to these levels day after day.
Indicator type: Price action and support/resistance (chart overlay)
Preferred instruments: FX pairs, gold, indices and any symbol with a daily session
Preferred periods: M1 to H1. The indicator draws nothing on H2 and above.
Platform: cTrader Windows and Mac (desktop only)
Trading use cases
- Seeing where each day and week starts at a glance
- Watching how price reacts at the previous day’s high, low and close
- Reviewing past days to study breakouts, sweeps and rejections at these levels
- Planning targets and stops around the previous day’s range
What it draws
- Day separator: a lines-dots vertical line at the start of each trading day
- Week separator: a solid vertical line at each week boundary
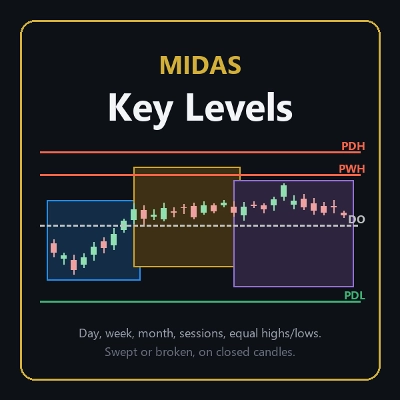
- Previous day high and low (PDH/PDL): lines-dots lines across the following day
- Previous day close (PDC): a solid line across the following day
Each day’s levels span that day only, so past days stay easy to read. Today’s levels run to the right edge of the chart. PDH, PDL and PDC labels show for today, with an option to label past days too.
Accurate trading days
Days follow your broker’s own daily candles, so the lines match its D1 chart. On brokers with a short Sunday candle, that candle counts as part of Monday, so Friday’s levels carry into Monday as they should.
Colors that fit your chart
In Auto mode, lines are grey on a light chart and white on a dark chart. They update straight away if you switch theme. In Custom mode, every line type has its own color.
Settings
- Show or hide each line type
- Colour, line style and thickness for each line type
- Number of past days to draw (all by default)
- Label options
Notes
- The indicator does not place trades or predict price.
- Previous day levels are reference points, not signals. Always use proper risk management.
Trading involves risk. Past performance does not guarantee future results.
Summary
Key features include:
- Day separators (lines-dots vertical lines) and week separators (solid vertical lines).
- Previous day high and low (PDH/PDL) shown as lines-dots lines.
- Previous day close (PDC) shown as a solid horizontal line.
- Levels are drawn for every day in the chart history, not just the current day.
- Labels for today’s PDH, PDL, and PDC with optional labels for past days.
- Automatic color adaptation to chart theme or customizable colors and line styles.
- Settings to show/hide line types, adjust colors, line thickness, and number of past days displayed.
The indicator uses the broker’s daily candle definitions to ensure accurate daily boundaries. It supports FX pairs, gold, indices, and any symbol with a daily session. DayContextPro does not generate trade signals or place trades; it provides visual reference levels to assist with planning targets, stops, and studying price behavior around previous day ranges.
Discussion
Customer reviews
5 | 75 % | |
4 | 25 % | |
3 | 0 % | |
2 | 0 % | |
1 | 0 % |