present
Sign up and get $50 off your first purchase
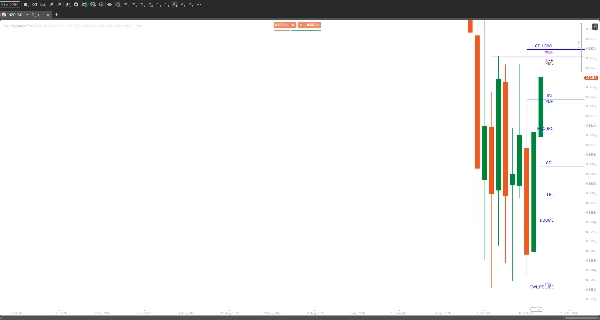
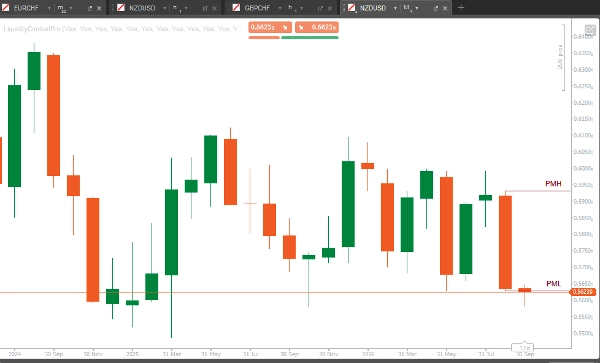
Trading product for LiquidityContextPro Indicator Key Levels, image 1
LiquidityContextPro
Indicator
Version 1.0, Oct 2026
Windows, Mac
Trading product for LiquidityContextPro Indicator Key Levels, image 2
Trading product for LiquidityContextPro Indicator Key Levels, image 3
Trading product for LiquidityContextPro Indicator Key Levels, image 4
Trading product for LiquidityContextPro Indicator Key Levels, image 5
Since 09/03/2026

Description

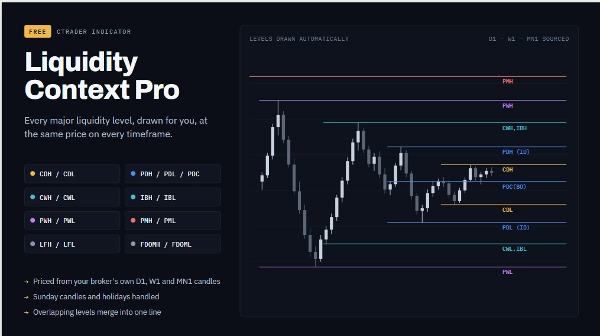
Stop redrawing the same levels on every new chart. Liquidity Context Pro draws all major liquidity levels instantly and keeps them updated as each day, week and month rolls over.


LEVELS

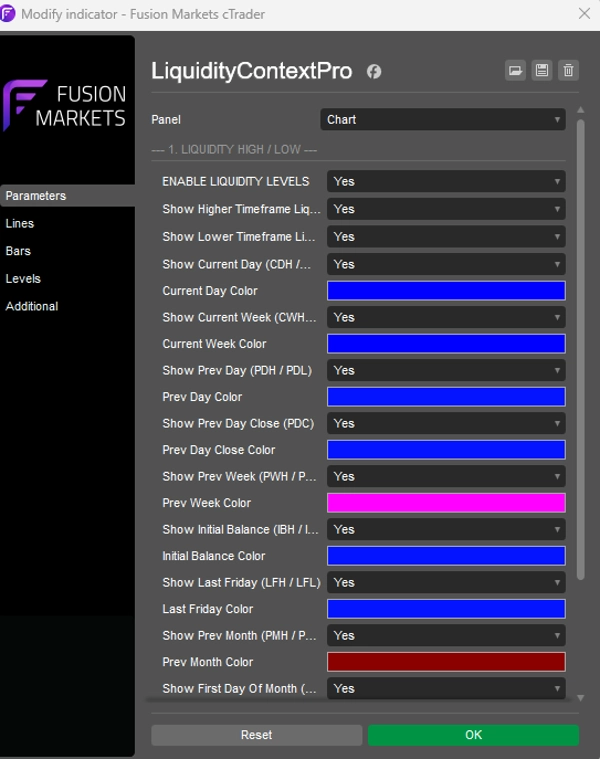
- CDH/CDL, CWH/CWL: current day and week, live

- PDH/PDL (Inside Day tag), PDC (breakout tag)

- PWH/PWL, PMH/PML: previous week and month

- IBH/IBL, LFH/LFL, FDOMH/FDOML


HOW TRADERS USE THEM

- Break and retest: price closes through a level, comes back, and holds it. The trend often continues.

- Sweep and reject: price trades through a level but closes back inside. A reversal becomes more likely.


WHY IT'S DIFFERENT

- Priced from your broker's own D1, W1 and MN1 candles: same price on every timeframe

- Sunday candles and holidays handled

- Levels at the same price merge into one line


DISCLAIMER

For chart analysis and education only, not financial advice. Trading involves high risk. No level guarantees a continuation or a reversal; use your own analysis and risk management.
Summary

AI summary
LiquidityContextPro is a trading indicator that automatically plots major liquidity levels on price charts, including current and previous day, week, and month highs and lows (e.g., PDH/PDL, PWH/PWL, PMH/PML), as well as other key levels like IBH/IBL and FDOMH/FDOML. These levels are derived from your broker’s daily, weekly, and monthly candles, ensuring consistent pricing across all timeframes. The indicator updates levels in real time as each day, week, and month progresses, eliminating the need to redraw them manually on new charts. It handles special cases such as Sunday candles and holidays, and merges overlapping levels into single lines for clarity. Traders use these levels to identify potential break and retest scenarios, where price closes beyond a level and then holds it, or sweep and reject patterns, where price briefly moves through a level but closes back inside, signaling possible reversals. The indicator is designed for chart analysis and educational purposes and does not provide financial advice.
Indicator profile

Customer reviews

0.0
Reviews: 0
Customer reviews
No reviews for this product yet. Already tried it? Be the first to tell others!

Discussion

FAQ

Key Levels
Products available through cTrader Store, including trading bots, indicators and plugins, are provided by third-party developers and made available for informational and technical access purposes only. cTrader Store is not a broker and does not provide investment advice, personal recommendations or any guarantee of future performance.

More from this author

Indicator
EMA
Flag
+2
Liquidity levels, trend lines, filtered chart patterns and a composite bias HUD in one cTrader overlay.
Indicator
BOS
CHOCH
+5
SMC structure indicator for cTrader: BOS/CHoCH, order blocks, FVGs, liquidity sweeps, key levels and alerts.
Desktop plugin
Chart UI Tools
Replay your broker’s charts candle by candle. Rewind any time, switch timeframes and practise trades with full stats.

You may also like

Indicator
Market Sessions
Indicator
Prop
Forex
+11
Inside Candle PRO - Professional Inside Bar Pattern Detector
Indicator
SMC
VWAP
+5
Most advanced Volume Profile Pivot Box indicator — auto pivots, volume zones, smart candle coloring & SMC trading tool.
Indicator
ATR
RSI
+19
Multi-timeframe heatmap scoring Direction, Strength & Volatility at a glance!
Indicator
Drawdown Monitor
Protect your funded account. Real-time Daily Equity Drawdown monitor with Green / Orange / Red flashing alerts.
Indicator
Imbalance
Fair Value Gap
+1
Multi-symbol, multi-timeframe Fair Value Gaps in one panel.
Indicator
SMC
Prop
+9
PDL/PDH/PWL/PWH and Session higs/lows (customizable)
Indicator
EMA
VWAP
+2
ORB Range Indicator maps the opening range and gives a practical session-breakout workflow with clear labels.
Indicator
MSS
Volume
+3
Rejection-based volume profile with tiered heat zones, POC levels and a fully draggable anchor on cTrader.
Indicator
Supertrend
Moving Average
Adaptive MA anchored to structural trend changes — no fixed period. Dual Supertrend + swing detection.
Indicator
MCDX is a powerful and innovative indicator.
Indicator
RSI
Signal
+1
Multi-timeframe version of the Quantitative Qualitative Estimation (QQE) indicator.
Indicator
Key Levels
Order Block
+5
Order blocks, fair value gaps, liquidity sweeps and a 24-timeframe signal scanner on one chart.
Indicator
The Advanced Volume Profile Indicator calculates POC, Median, and Mode, revealing key price levels for smarter trading.
Indicator
ATR
RSI
+4
RSI bands drawn on price, confluence-scored BUY/SELL signals, an ATR stop with three targets
Indicator
AI
ATR
+27
COT Flows. Clear Direction. 🧭
Indicator
Prop
Forex
+5
Color Volume Bars – Visualize Market Strength Instantly
Indicator
AI-assisted
Order Block
+5
The daily bias estimator indicator uses ICT concepts to show whether the chart is bullish or bearish on multi-time frame

Price

Since 09/03/2026