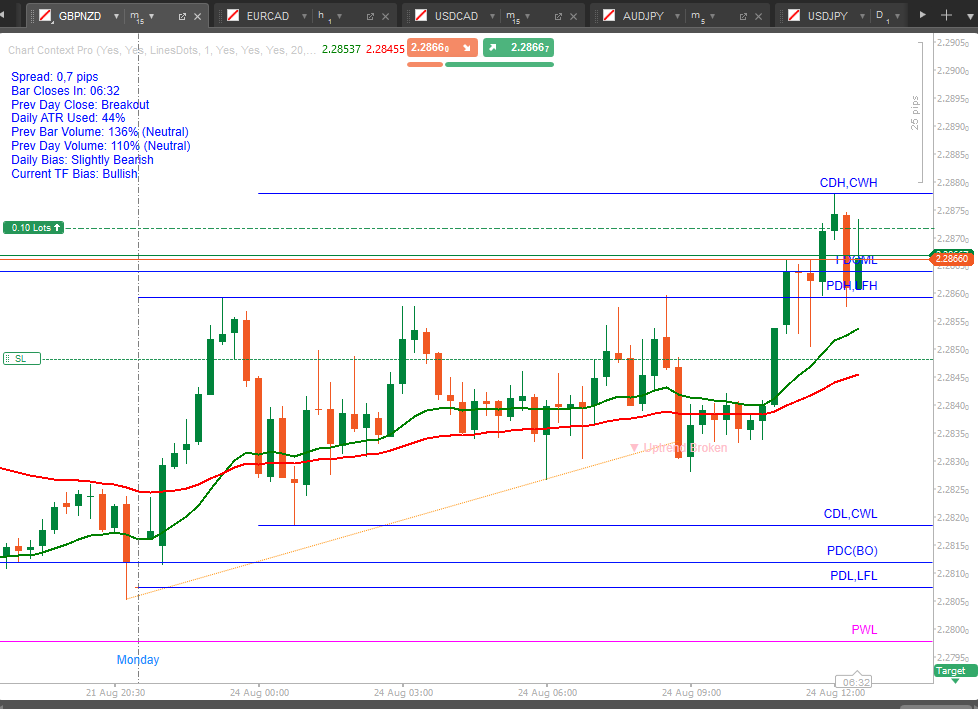
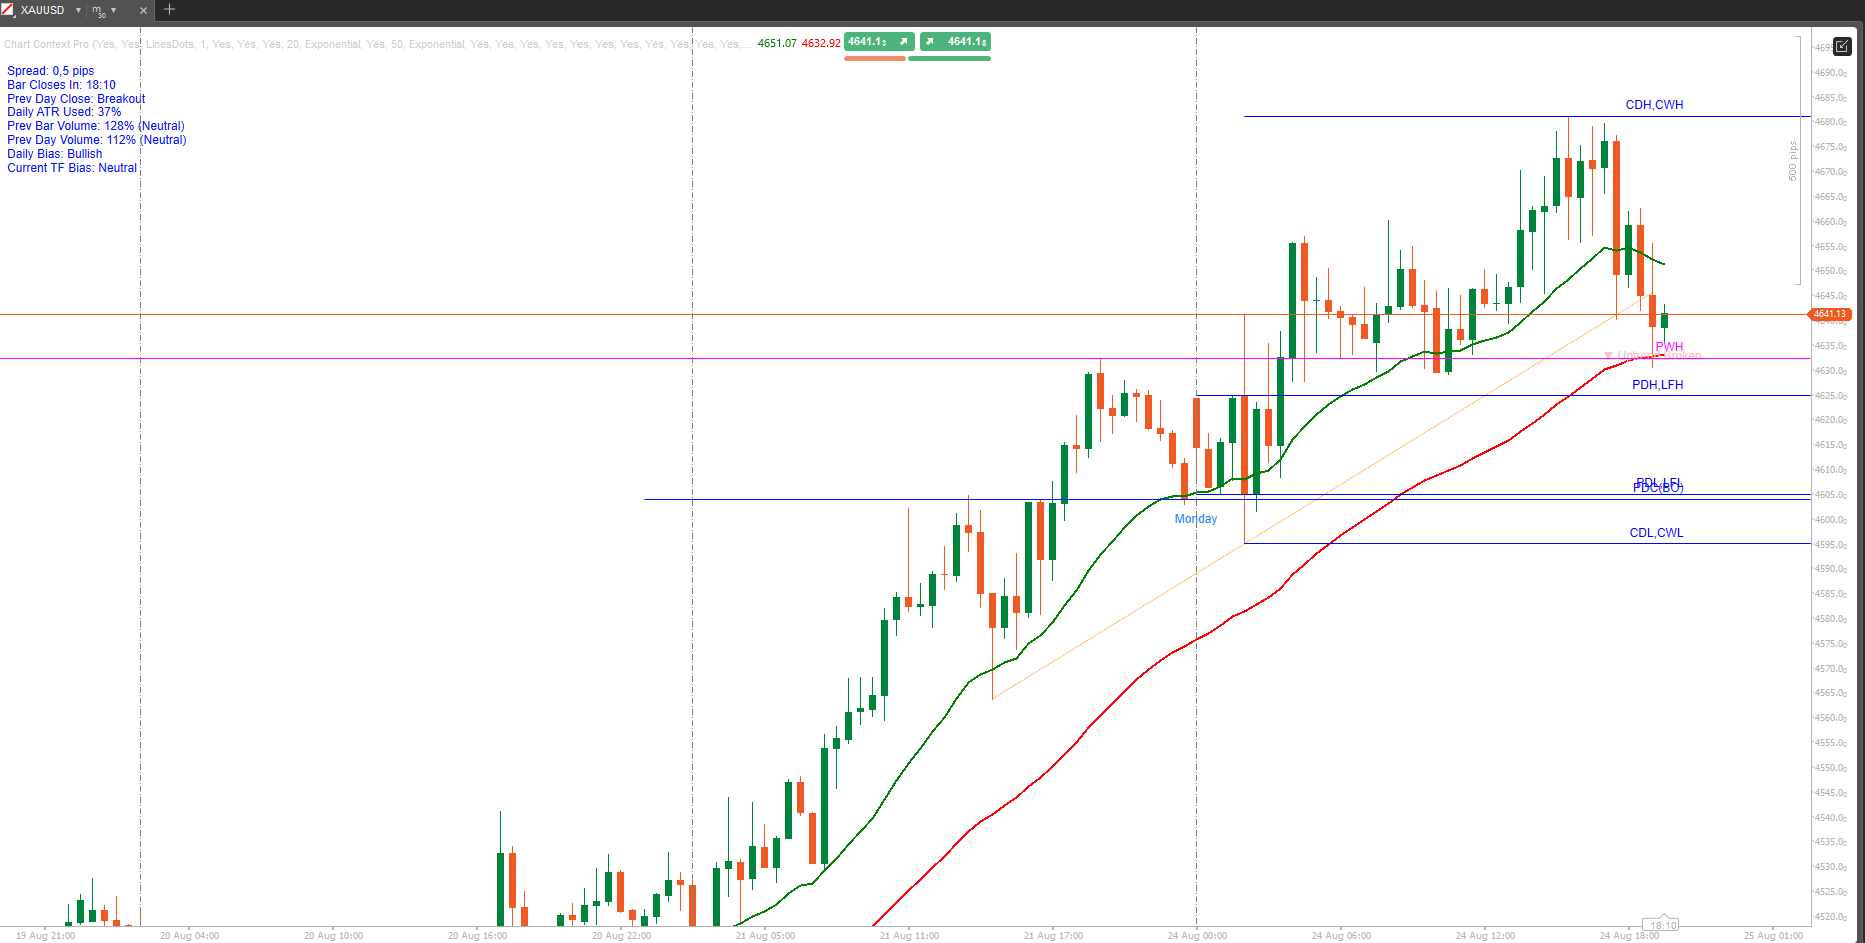
Description
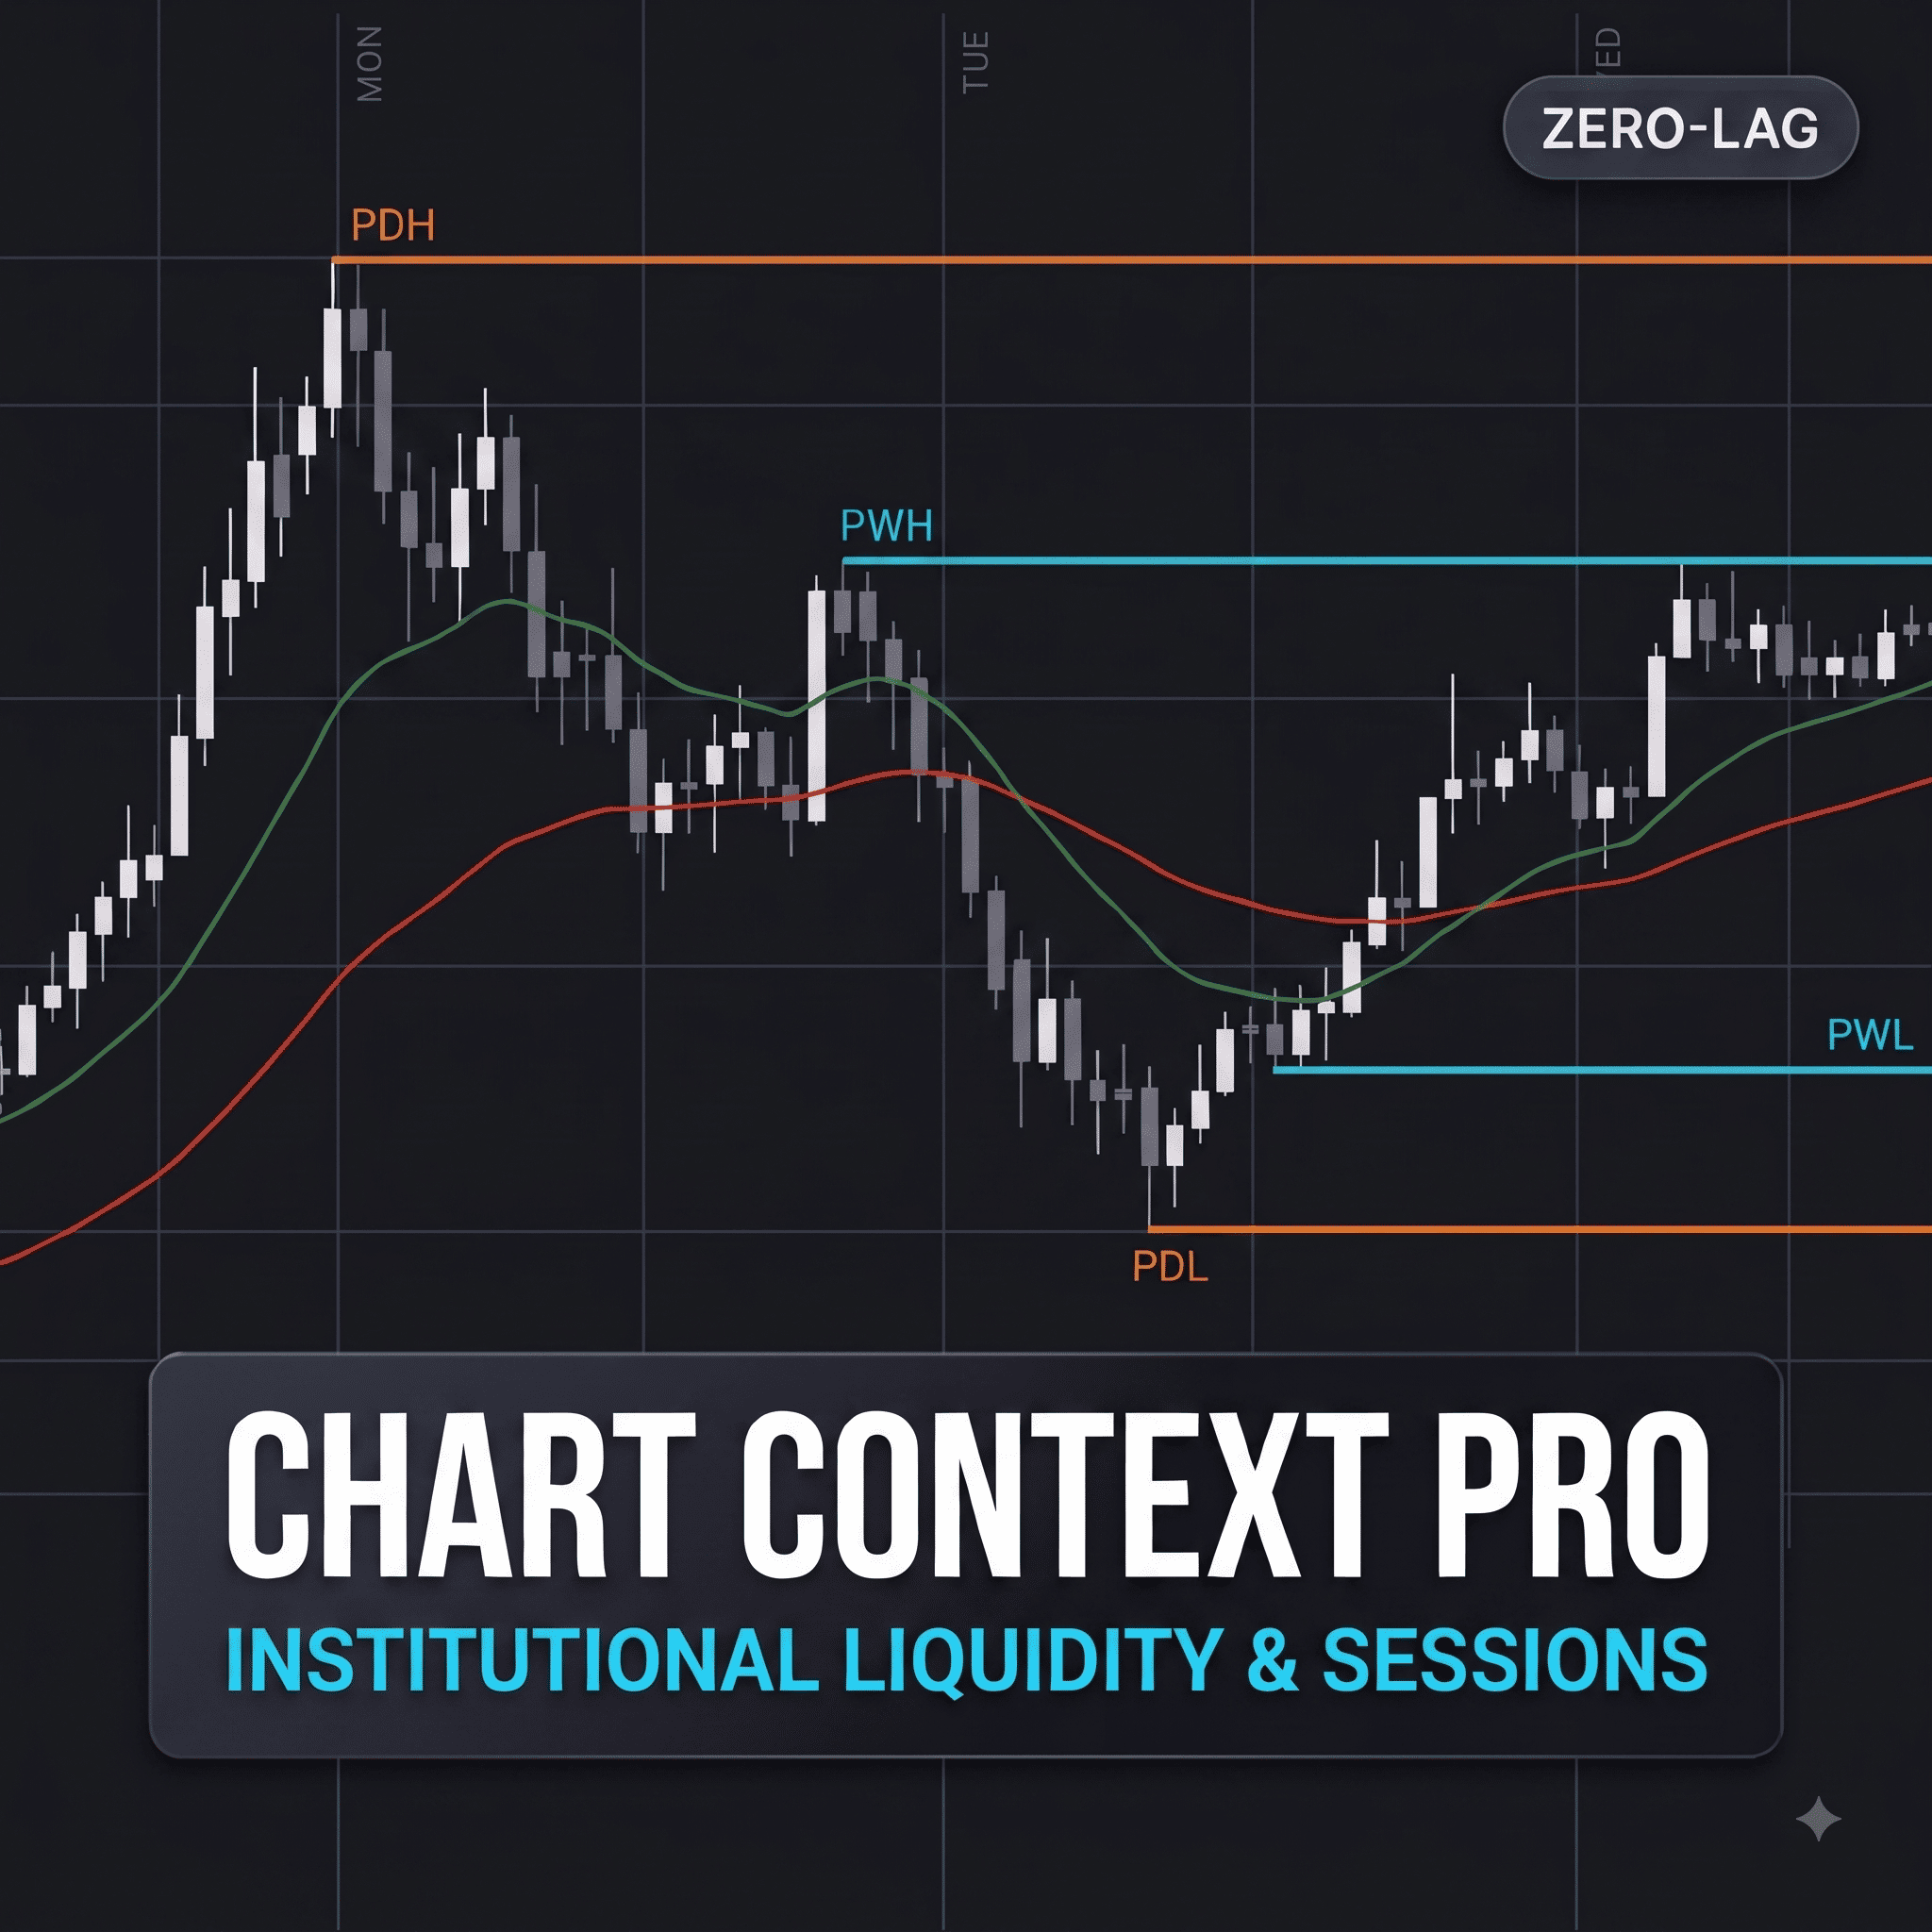
ChartContextPro is a multi-module chart overlay that combines session separators, moving averages, nine liquidity levels, automatic trend lines, a filtered chart-pattern engine and a heads-up display with composite market bias. Every pattern must pass volatility, volume, market-regime, prior-trend and risk/reward filters before it is drawn, so the chart shows fewer, cleaner signals. Each confirmed pattern is marked with a breakout arrow and a defined stop-loss line.
Indicator type: Trend, price action, support/resistance and volume context (chart overlay)
Preferred instruments: Major and minor FX pairs, gold and major indices
Preferred periods: M15 to H4 for patterns, trend lines and intraday levels; D1 and W1 for higher-timeframe context
Platform: cTrader Windows and Mac (desktop only)
Trading use cases
- Marking key liquidity levels for entries, targets and stop placement
- Getting a structured read on directional bias before taking a trade
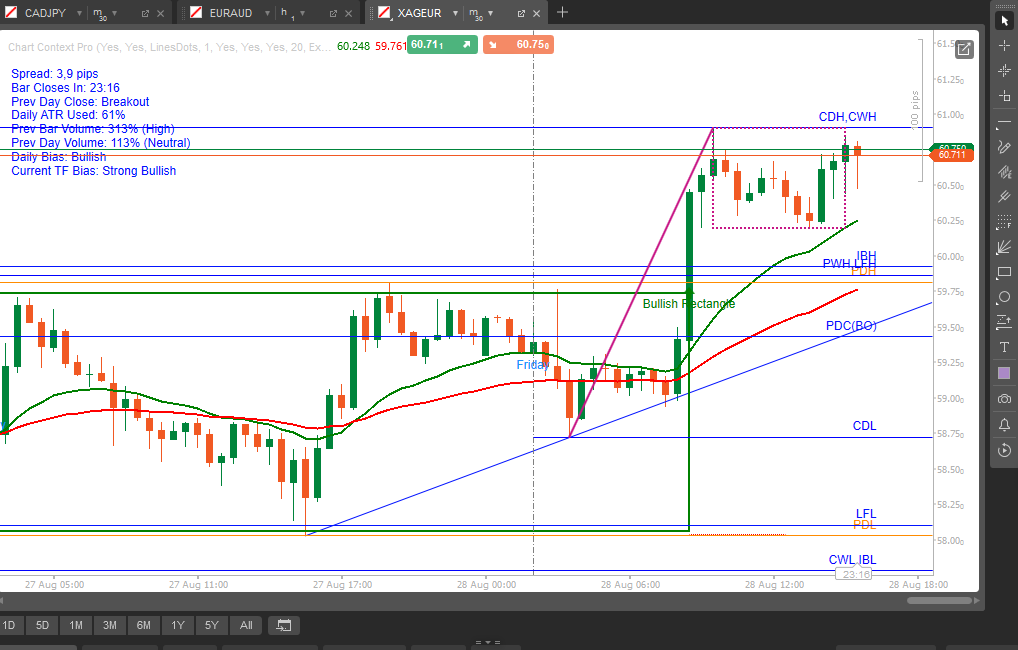
- Spotting confirmed breakouts from wedges, flags, pennants, rectangles and cup & handle patterns
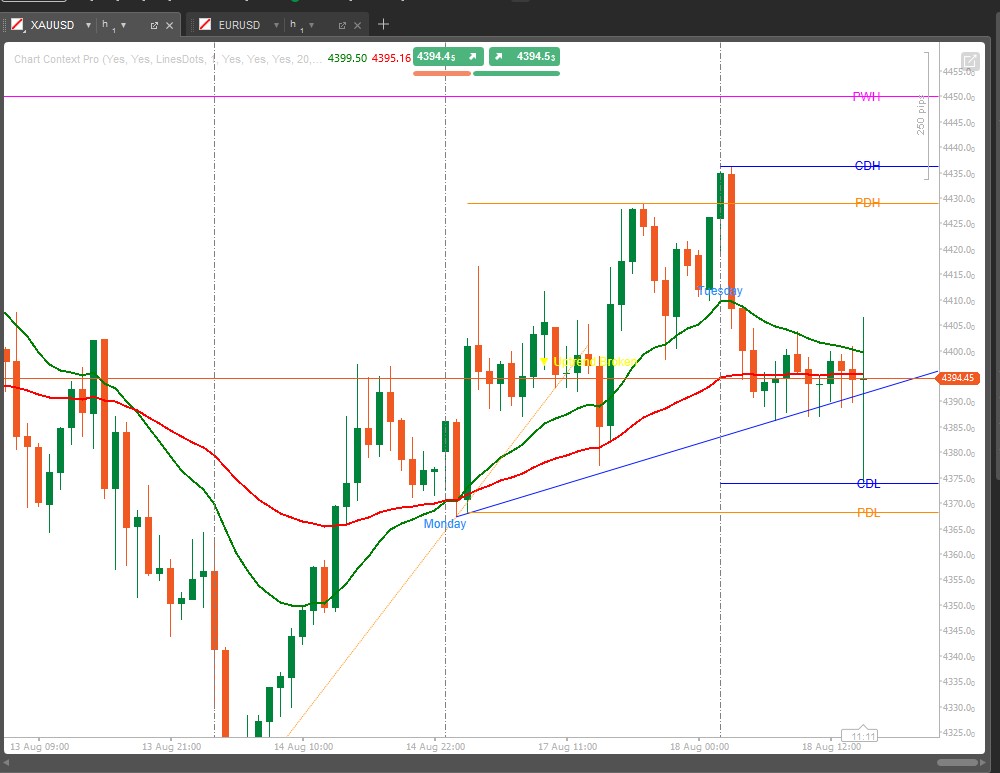
- Tracking active and recently broken trend lines
Liquidity levels
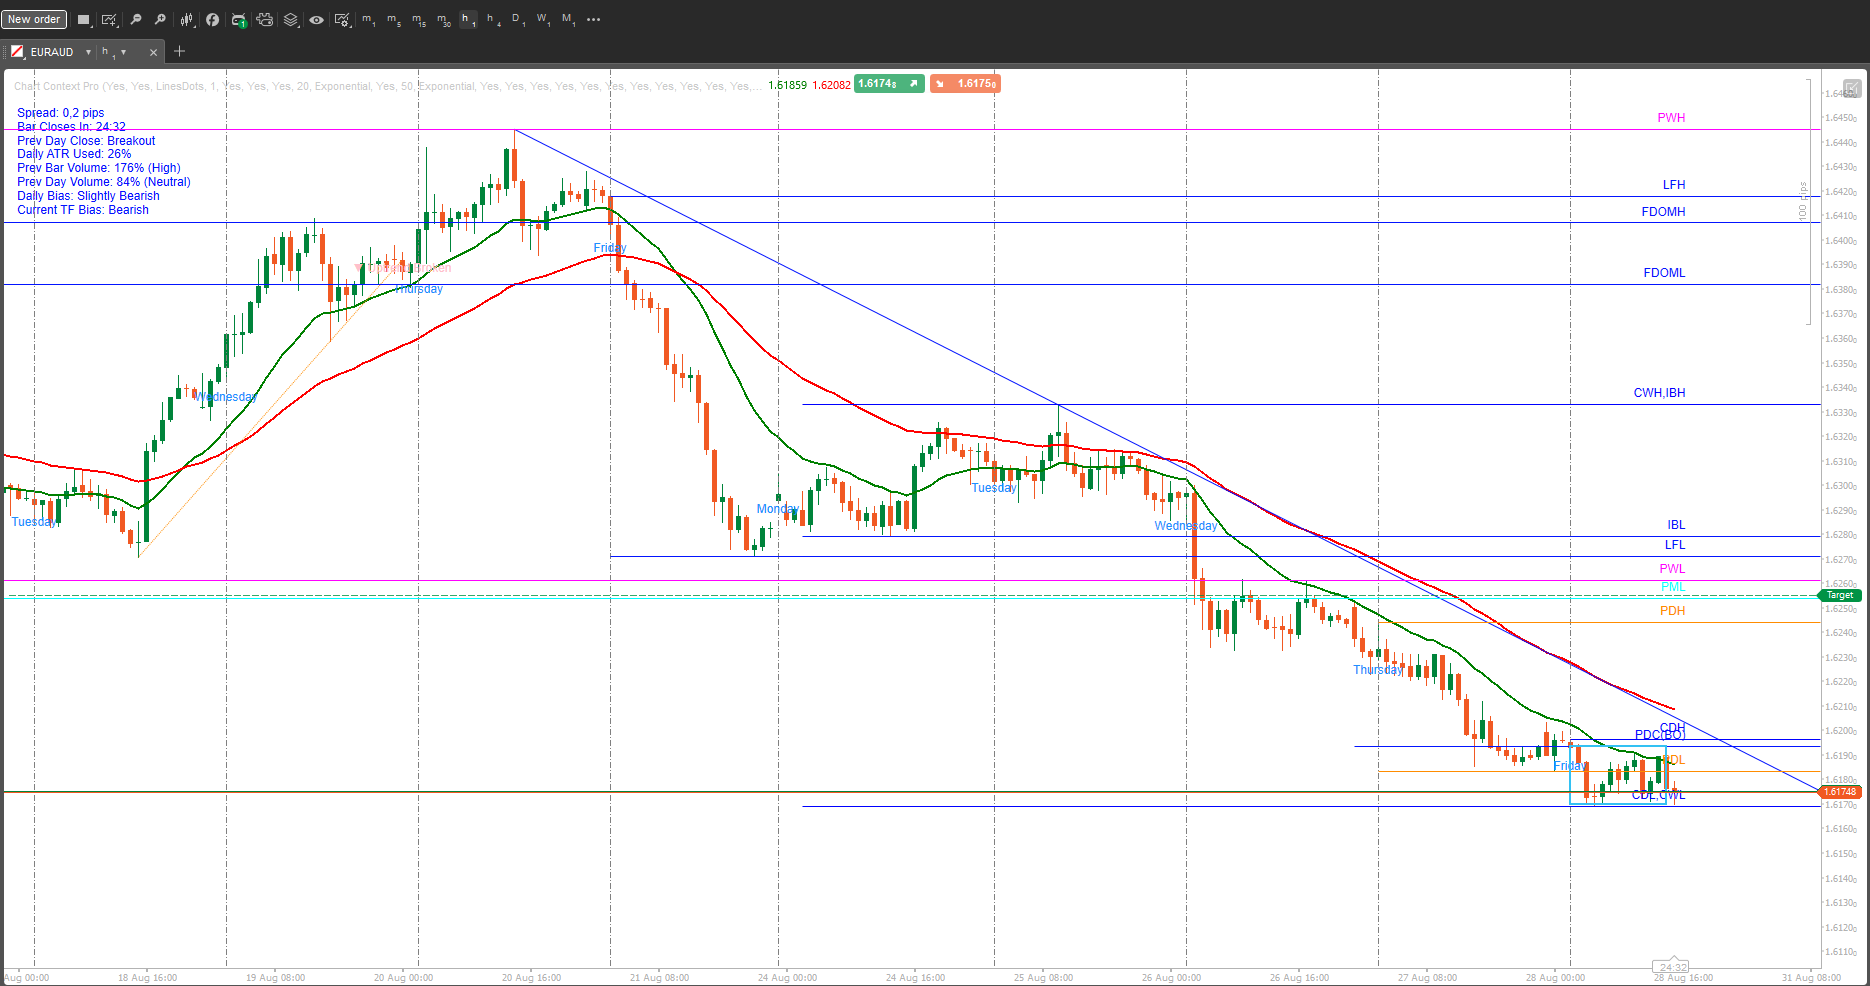
- CDH/CDL and CWH/CWL: current day and week high/low, updated on closed bars only
- PDH/PDL: previous day high/low, tagged (ID) when yesterday was an inside day
- PDC: previous day close, tagged (BO) when yesterday closed beyond the prior day’s full candle body
- PWH/PWL and PMH/PML: previous week and month high/low
- FDOMH/FDOML: high/low of the current month’s first trading day
- IBH/IBL (Initial Balance): Monday’s range, then locked at the wider of Monday’s and Tuesday’s ranges for the rest of the week
- LFH/LFL: high/low of the previous week’s last trading day
Previous-day levels are read from the broker’s own daily bars, so they match the broker’s session on every timeframe. Levels that land on the exact same price merge into one line with a combined label. Each level can be toggled and coloured individually, and two master toggles show or hide the daily-and-below or weekly-and-above group at once.
Composite bias (HUD)
Daily Bias and Current Timeframe Bias each combine five votes into a label from Strong Bearish to Strong Bullish:
- Trend: swing-pivot market structure and price location relative to an approximate Point of Control, combined into one vote
- Momentum: the last close against the prior candle body, plus a short-term price change that must exceed a minimum ATR-relative move; a lone signal is ignored in ranging conditions
- Volume confirmation: above-average volume with a decisive close in the outer part of the bar’s range
- Relative strength: an optional, ATR-normalised comparison against a benchmark symbol you choose, with a positive or inverse correlation setting
- Position in range: where price sits within its longer-term high/low range
When the current move exceeds 100% of ATR, the label gets an “(ATR Exhausted)” tag as an entry-timing warning. Current Timeframe Bias runs on any time-based timeframe, and on a D1 chart it mirrors Daily Bias.
The HUD also shows spread, bar close countdown, previous day close breakout status, Daily ATR % used, and previous bar and previous day volume against an average or median baseline.
Chart patterns
- Rising and falling wedges: reversal, continuation or both; stop at the opposite boundary or the pattern extreme
- Bull and bear flags and pennants
- Bullish and bearish rectangles: a standard detector and a separate wide-range (macro) detector, with reversal, continuation or both modes
- Cup & handle
Patterns confirm only on a candle close beyond the boundary, never on an intrabar wick. The quality filters cover:
- ATR-relative minimum size
- Declining volume during formation and a volume spike on breakout (each optional)
- A wider confirmation margin in ranging markets (ADX)
- A required prior trend
- Body containment within the boundaries
- A minimum risk/reward ratio, applied to every pattern except rectangles
- Signal cooldowns
- A cap on how many patterns stay on the chart
Flag and cup & handle size thresholds are percentage-based. For FX intraday charts, lower Min Flagpole Move and Cup Min Depth.
Trend lines
Uptrend and downtrend lines are tracked independently and can both be on the chart at once. Each candidate line must pass minimum span, minimum move and maximum slope checks, and price must respect the line between its two anchors. A close through the line marks it as broken and labels the break, and a configurable number of recent broken lines stay visible.
Also included
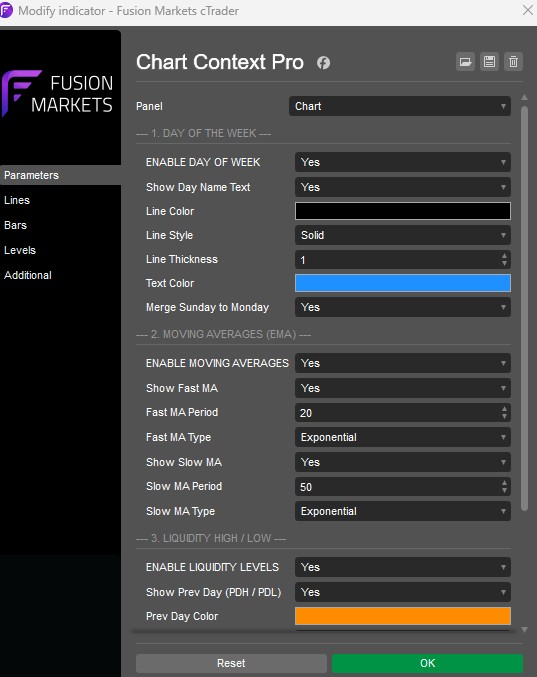
- Fast and slow moving averages (EMA, SMA or other types)
- Day separators with day-name labels and an optional Sunday-to-Monday merge
Notes
- FX and CFD symbols use tick volume, not exchange volume.
- The Point of Control is approximated from bar data, not tick-level trades.
- The benchmark comparison is optional and reads neutral when no symbol is set.
- This indicator does not place trades or predict price. Patterns can fail, so always use proper risk management.
Trading involves risk. Past performance does not guarantee future results.