
Leverage Liquidation Map
インジケーター
5 購入済
バージョン 1.0、Feb 2025
Windows、Mac
4.3
レビュー: 3
説明
🔍 特定の過去期間の出来高データを調査し、高いレバレッジをかけた投資家が清算に直面する可能性のある領域を強調表示し、市場の動向に関する貴重な洞察を提供します。
このインジケーターは何をするのですか?
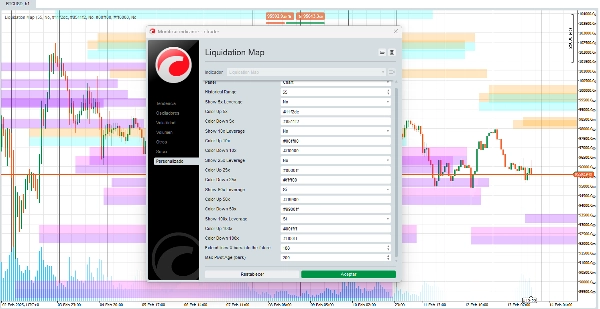
このアルゴリズムは、大規模な清算(5倍、10倍、25倍、50倍、または100倍などのレバレッジポジション)の発生が予想される価格レベルを特定します。これらのレベルは価格の動きの「磁石」として機能し、清算が急激な市場変動を引き起こす可能性があります。インジケーターはチャート上に水平線を描画し、これらの閾値を表し、将来に向けて投影して重要なゾーンを予測します。
これらのレベルはどのように計算されますか?
- 価格のピボット検出:
🔄 チャート上の最近の高値と安値(価格が方向を変えるポイント)を特定します。これらのピボットが清算レベルの計算の基礎となります。 - トリガーとしての出来高:
📊 現在の出来高を過去の平均と比較します。出来高が特定の閾値(例:100倍の平均の1.2倍)を超えると、対応する清算レベルが有効になります。 - 清算の計算式:
レバレッジが高いほど、清算レベルは現在の価格に近くなります。 -
- ロングポジションの場合: 清算レベルはピボットの安値の下に設定され、レバレッジに基づいて計算されます(例:50倍の場合は2%下)。
- ショートポジションの場合: レベルはピボットの高値の上に設定され、同じ原理が適用されます。
使用時に期待できることは?
- 流動性ライン: 🎨 清算による高いボラティリティが予想されるゾーンを表すカスタマイズ可能な水平線が表示されます。
- 設定可能なレバレッジ: ⚙️ 各レバレッジタイプのレベルを有効/無効にできます(例:50倍と100倍のみを対象にする)。
- 色のカスタマイズ: 🌈 各清算範囲の色を選択でき、視覚化を好みに合わせて調整できます。
- 混雑ゾーン: 🎯 複数のラインが近接している場合、複数の清算が同時に発生する可能性のある高リスク/高リターンのエリアを示唆します。
シグナルの解釈方法は?
- 価格がラインに接近: 🚨 価格が清算レベルに近づくと(特に出来高が多い場合)、急激な動きの可能性が高まります。
- 色と透明度: 🎨 色はレバレッジによって異なります(例:25倍は青、50倍はオレンジ)。透明度は関連する出来高の「強さ」を示し(濃いライン=より重要な出来高)、視覚的に表現します。
なぜ役立つのですか?
- 積極的な予測: 🔮 過去を分析するだけでなく、現在の状況に基づいて将来のレベルを予測します。
- 市場心理への注目: 🧠 強制清算は連鎖反応を引き起こすことが多く(例:ストップロス注文がさらなる売りを誘発)、このインジケーターはそれらを予測するのに役立ちます。
- カスタマイズ性: 🛠️ 視覚化を戦略に合わせて調整できます(例:ボラティリティの高い市場で高いレバレッジを優先)。
考慮すべき制限事項
- 出来高依存性: 📉 出来高が低い場合や過去データが不十分な場合、シグナルの信頼性が低くなることがあります。
- 万能の予言ではない: 🔮 レベルは可能性のあるゾーンを示すものであり確実性ではありません。常に他の分析と組み合わせて使用してください。
- 動的な環境: 🌍 予期しないニュースがある市場では、清算が予測レベル外で発生することがあります。
Ctrader Storeのインジケーター:
Dynamic Market Structure
Analysis of Turning Points
Fibonacci Linear
Regression Multi-timeframe
Multi-Level Candle Bias
Tracker
Auto Support and
Resistance Trend Lines
概要
AIによる概要
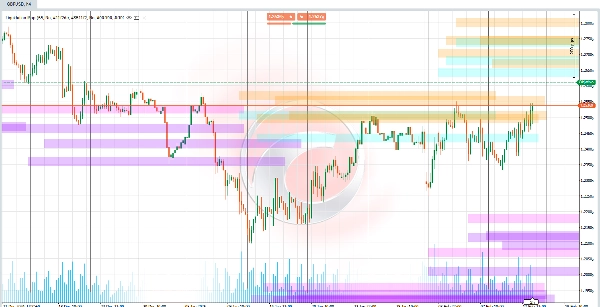
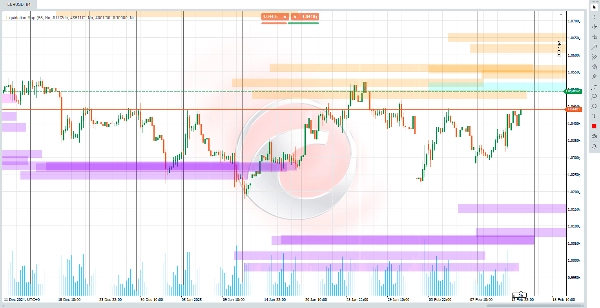
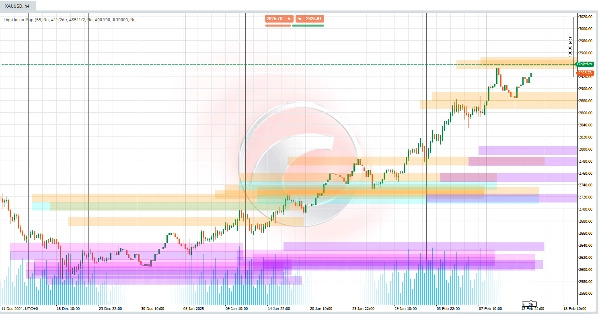
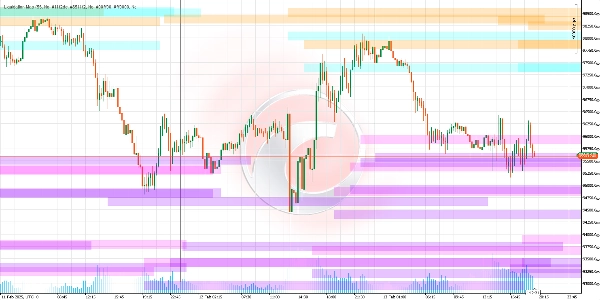
Leverage Liquidation Map is an indicator that analyzes historical volume data to identify price levels where large liquidations of leveraged positions (5x to 100x) are likely to occur. These liquidation levels act as magnets for price movements and are displayed as horizontal lines on the chart, projected into the future to highlight key zones of potential market volatility.
The indicator calculates these levels by detecting recent price pivots (highs and lows), comparing current volume against historical averages to activate relevant leverage thresholds, and applying a formula where higher leverage corresponds to liquidation levels closer to the current price. For long positions, liquidation levels are set below pivot lows; for short positions, above pivot highs.
Users can customize the indicator by enabling or disabling specific leverage levels and adjusting the colors of the liquidation lines. Clusters of lines indicate congestion zones with heightened risk and potential for sharp price swings. The transparency of lines reflects the strength of associated volume.
This tool aids in proactive forecasting of market moves driven by forced liquidations, helping traders anticipate volatility and market psychology effects. It is volume-dependent and should be used alongside other analyses, as it indicates probable zones rather than certainties.
インジケーターのプロフィール
カスタマーレビュー
4.3
レビュー: 3
5 | 67 % | |
4 | 0 % | |
3 | 33 % | |
2 | 0 % | |
1 | 0 % |
カスタマーレビュー
February 17, 2025
Patient signal check for traders who combine signals before acting. It gives value around chart reading, but it should not be used as a blind entry trigger. The cleaner reads should hold across 3 sessions, not just 1 good chart. It is stronger when a 1.5R target is realistic before the entry.
February 16, 2025
February 16, 2025
Realistic setup support for chart reading. it makes market context easier to scan, especially when used for adding confirmation before a trade. I would test it on 2 timeframes, 20 signals and a 1R stop plan. It is stronger when a 1.5R target is realistic before the entry.
ディスカッション
よくあるご質問
Breakout
Supertrend
RSI
cTrader Storeで入手可能な取引ボット、インジケーター、プラグインなどの商品は、第三者の開発者が提供するものであり、情報と技術の取得のみを目的としてご利用いただけます。cTrader Storeはブローカーではなく、投資助言や個人的な推奨を行うことも、将来のパフォーマンスを保証することもありません。


価格
登録日 03/10/2024
163
販売
39.2K
無料インストール