説明
VWave Dual Edge — 理論ではなく実際の取引から作られたもの
私はこのインジケーターを売るために作ったのではありません。自分が必要だったから作りました。
数か月にわたるテスト、損失、調整、そしてライブチャート上での洗練を経て—スキャルピングとスイングの時間枠で—私は実際に信頼できるものを手に入れました。その時に初めて共有することを決めました。
VWave Dual Edgeの機能:
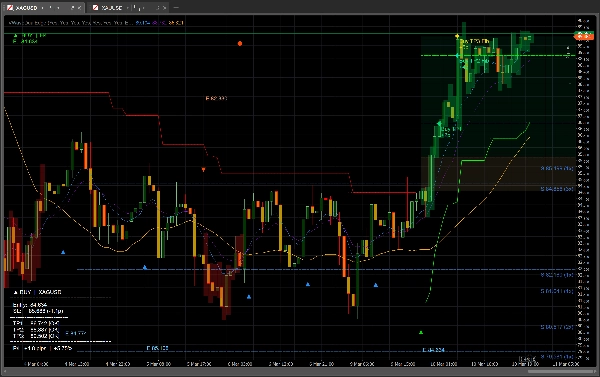
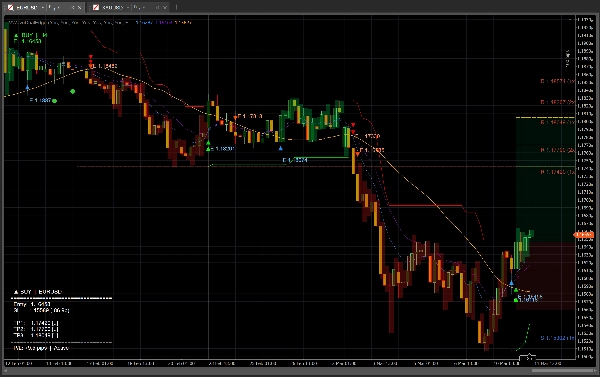
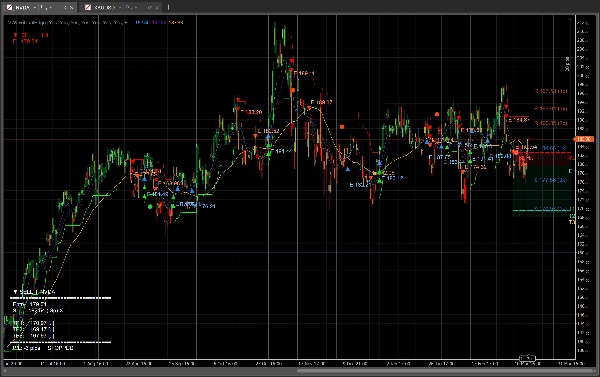
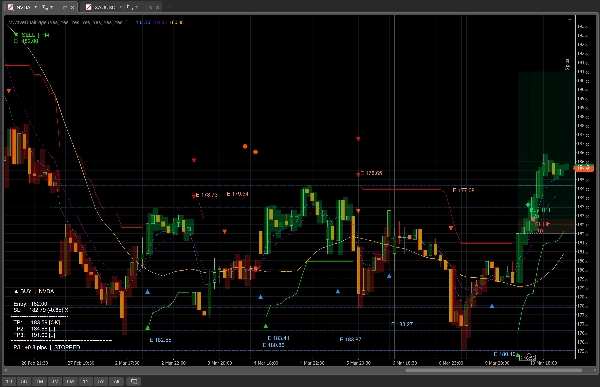
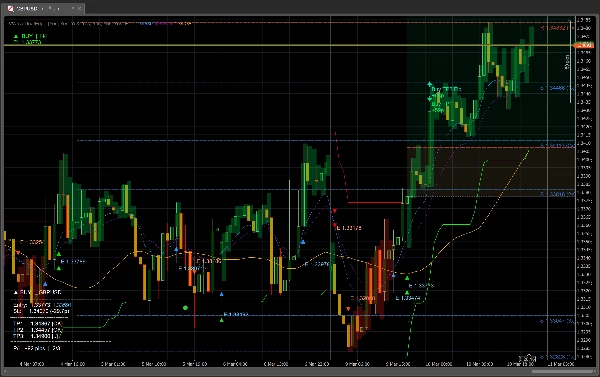
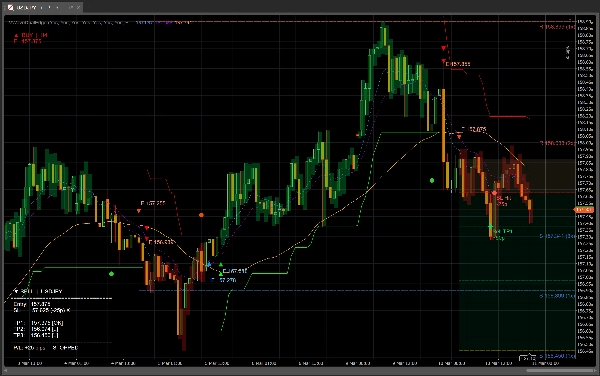
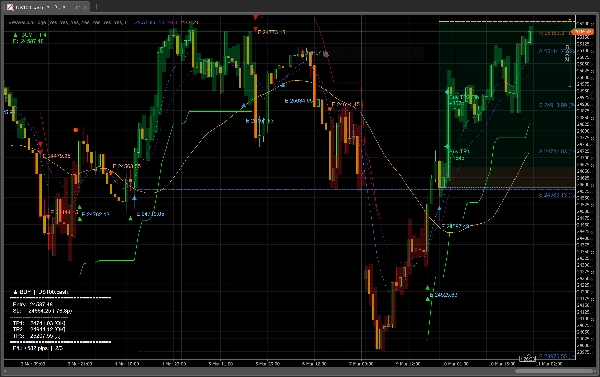
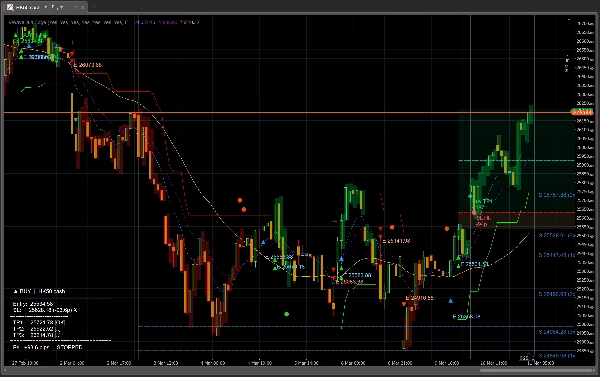
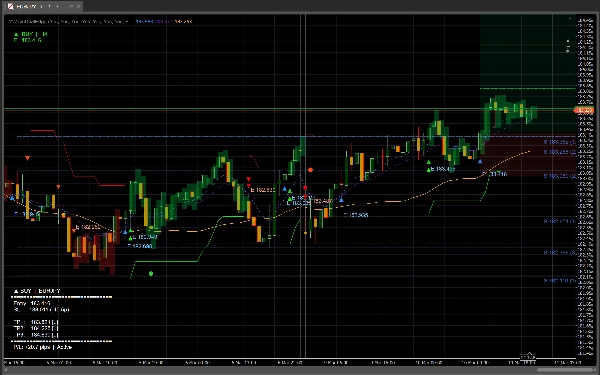
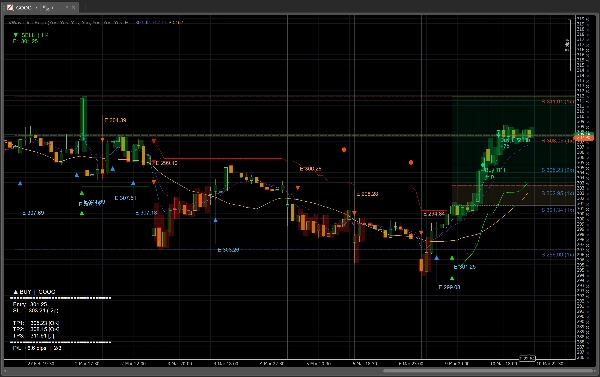
VWave Dual Edgeは、どの時間枠、どの銘柄でも機能する完全なトレーディングアシスタントです。トレンドの方向、エントリーシグナル、スマートなリスク管理、重要な価格レベルを一つのクリーンなオーバーレイにまとめています。
主な特徴:
— 時間枠に応じて自動調整されるトリプルMAシステム — トレンド確認のためのSuperTrendフィルター — 過買い・過売りの罠を避けるRSIフィルター — スマートストップロス:ATRベースまたは固定ピップス — ギャップスマートSL:価格ギャップを検出し自動調整 — 3つのテイクプロフィットターゲット:スマートS/R、リスク・リワード、またはATRベース — 各ターゲット達成後のフィボナッチTP再計算 — フラクタルから自動検出されるサポート&レジスタンスレベル — コンソリデーションブレイクアウトから自動検出されるサプライ&デマンドゾーン — HTFパネル:上位時間枠のバイアスを一目で確認 — リエントリーシステム:TP1後のプルバックエントリーをキャッチ — フルインフォパネル:エントリー、SL、TP1/2/3、損益 — チャート上でライブ表示
対象者:
— ノイズなしで速く明確なシグナルが必要なスキャルパー — 構造、レベル、忍耐が必要なスイングトレーダー — 5つの異なるインジケーターを使い分けるのに疲れた人
正直な注意点:
このインジケーターがすべての取引を勝ちにするわけではありません—そんなものはありません。これが提供するのは、感情ではなく論理に基づいた意思決定ができる、構造化され再現可能なフレームワークです。私は毎セッション、自分でも使っています。
選りすぐりのバックテストも、非現実的な結果もありません。トレーダーによるトレーダーのためのツールです。
概要
カスタマーレビュー
5 | 50 % | |
4 | 50 % | |
3 | 0 % | |
2 | 0 % | |
1 | 0 % |