
说明
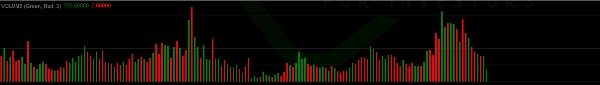
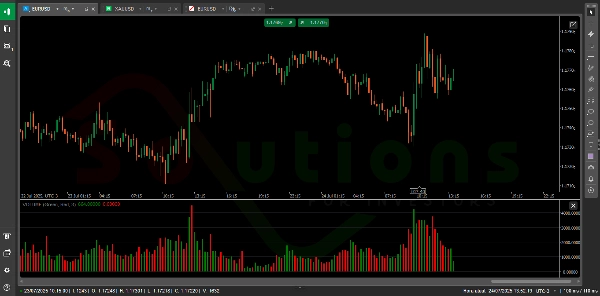
VolumeColorBar 是一个强大的工具,通过基于蜡烛方向的颜色编码条形图直观地表示市场成交量。绿色条表示看涨蜡烛(买入压力)上的成交量,而红色条表示看跌蜡烛(卖出压力)上的成交量。这使交易者能够立即评估市场活动更多地由买方还是卖方驱动——帮助确认突破,识别反转,并更有信心地改善交易时机。
摘要
AI 摘要
VolumeColorBar is a trading indicator that visualizes market volume using color-coded bars aligned with candle direction. It displays green bars for volume on bullish candles, indicating buying pressure, and red bars for volume on bearish candles, indicating selling pressure. This visual representation helps traders quickly assess whether market activity is dominated by buyers or sellers. The indicator supports various markets and symbols, including Forex pairs (EURUSD, GBPUSD, NZDUSD, USDJPY), cryptocurrencies (BTCUSD, crypto), commodities (XAUUSD, gold, oil, silver), indices (NAS100, SP500, DAX, Dow), and stocks. By providing immediate insight into volume dynamics relative to price movement, VolumeColorBar aids in confirming breakouts, identifying potential reversals, and improving trade timing decisions.
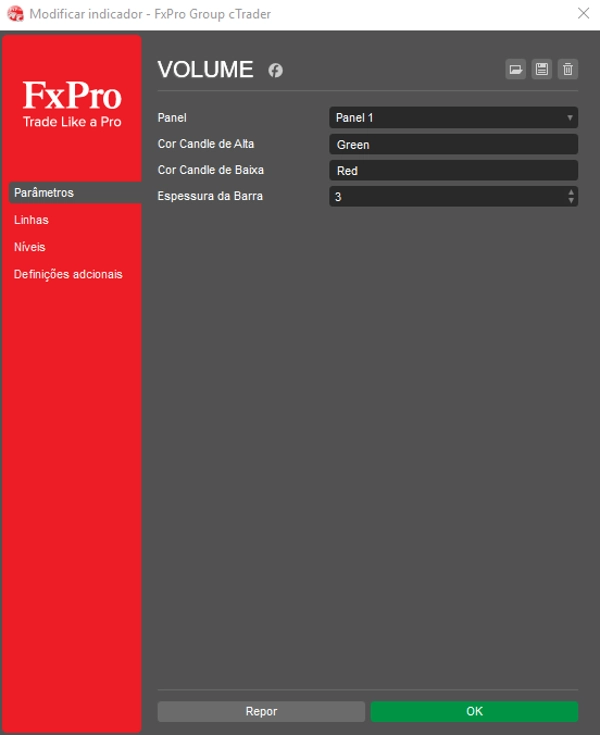
指标配置
客户评价
4.3
评价:3
5 | 33 % | |
4 | 67 % | |
3 | 0 % | |
2 | 0 % | |
1 | 0 % |
客户评价
April 14, 2025
Clean tool for workflow for a more controlled workflow. It helps with planning entries around the first range, but false breaks still need filtering. I would track 20 market opens, the first 30 to 60 minutes and a target near 1.5R. I would still keep manual review in the process.
April 13, 2025
April 13, 2025
Worth a closer look around opening range breakouts. The useful part is planning entries around the first range, with the numbers checked before scaling. The setup should be tested across at least 15 sessions because 2 or 3 fakeouts can change the picture. The trade idea is clear, but it needs a hard stop and a defined breakout rule.
讨论
常见问答
BTCUSD
Forex
Signal
Breakout
Indices
EURUSD
Commodities
GBPUSD
NZDUSD
Prop
Crypto
Stocks
XAUUSD
NAS100
USDJPY
cTrader Store 提供的所有产品,包括交易机器人、指标和插件,均由第三方开发者提供,仅供信息参考和技术访问之用。cTrader Store 并非经纪商,不提供投资建议、个人推荐或任何未来业绩保证。
该作者的其他作品


!["[Stellar Strategies] Inside Bar with Signals" 标识](https://cdn.ctrader.com/image/webp/1d9e8bfa-3b2c-4440-bb37-5856902008a7_30683)

价格
注册日期 05/02/2025
31
销售