
说明
自定义RSI – 精准捕捉现货反转,视觉清晰
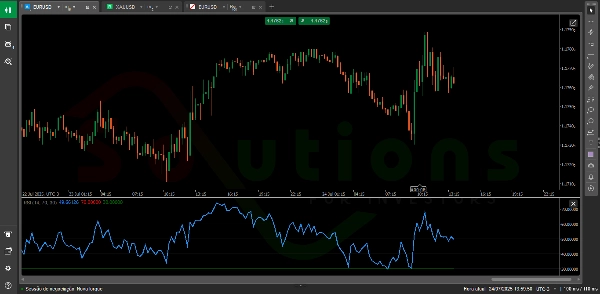
自定义RSI 是经典 相对强弱指数 (RSI) 的增强版本,旨在帮助交易者快速识别 超买和超卖区域——价格可能反转的关键区域。
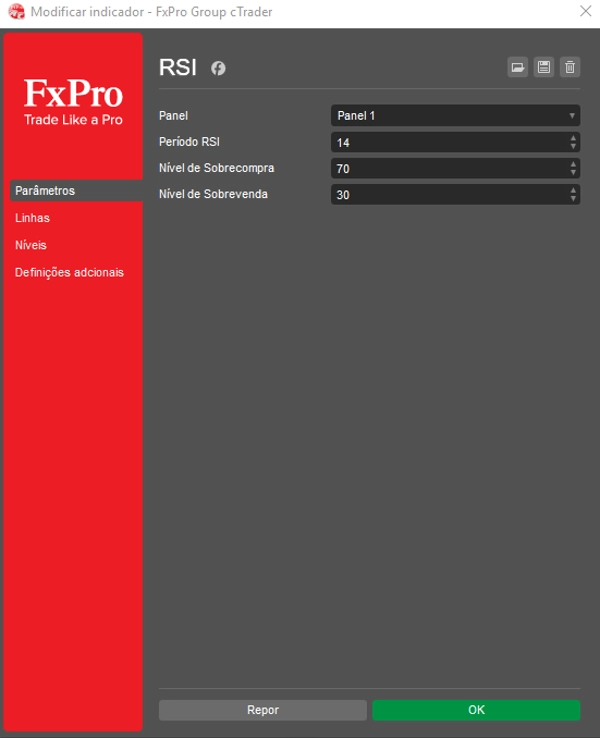
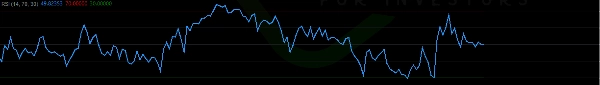
界面简洁直观,显示两个完全 可自定义的水平线(如传统的70和30水平),清晰标示图表上的高概率决策点。
✅ 调整时间框架和RSI水平以适应您的交易风格
✅ 更有信心地识别潜在反转区域
✅ 用清晰、无杂乱的指标增强您的技术分析
适合各级别交易者,自定义RSI 将原始价格数据转化为智能、可操作的洞察——使其成为盈利决策的必备工具。
摘要
AI 摘要
Custom RSI is a technical indicator based on the classic Relative Strength Index (RSI) designed to identify overbought and oversold market zones. It calculates price movement strength using candlestick closing prices and displays two customizable horizontal lines, typically set at levels like 70 and 30, to mark critical decision points. Users can adjust the timeframe and RSI levels to suit their trading style, facilitating the identification of potential reversal zones. The indicator offers a clean, uncluttered visual interface that supports enhanced technical analysis across various markets including Forex, stocks, commodities, indices, and cryptocurrencies. Custom RSI is suitable for traders aiming to improve decision-making by highlighting high-probability reversal areas on their charts.
指标配置
客户评价
4.0
评价:3
5 | 0 % | |
4 | 100 % | |
3 | 0 % | |
2 | 0 % | |
1 | 0 % |
客户评价
April 25, 2025
the workflow feels calmer, but it needs a few bad trades in the sample too.
April 20, 2025
April 12, 2025
the first reaction should not be the whole decision, but human context still matters here.
讨论
常见问答
BTCUSD
Forex
Signal
Indices
EURUSD
Commodities
GBPUSD
NZDUSD
RSI
Prop
Scalping
Crypto
Stocks
XAUUSD
NAS100
USDJPY
cTrader Store 提供的所有产品,包括交易机器人、指标和插件,均由第三方开发者提供,仅供信息参考和技术访问之用。cTrader Store 并非经纪商,不提供投资建议、个人推荐或任何未来业绩保证。
该作者的其他作品


猜您喜欢

!["[Stellar Strategies] Market Session Ultimate" 标识](https://cdn.ctrader.com/image/webp/61ffd537-0125-4246-9e72-42eca1791d64_28232)


价格
注册日期 05/02/2025
30
销售