
说明
ATR – 波动性与视觉精度
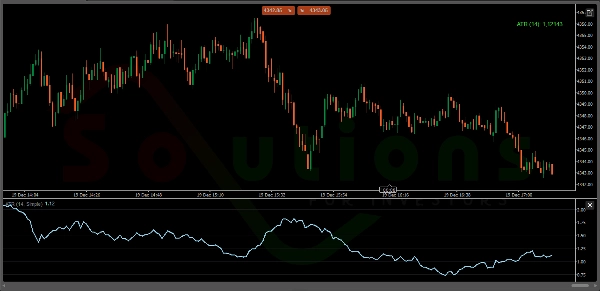
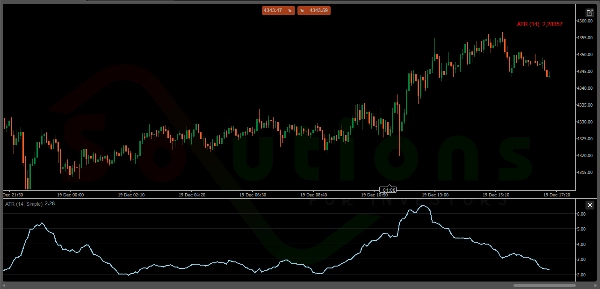
ATR 是交易者掌握市场区间的关键工具。这个为 cTrader 优化的版本提供了即时的波动性读取,将复杂数据转化为可操作的视觉洞察。
亮点:
- 实时仪表盘: 精确的 ATR 数值直接显示在图表上,便于快速计算止损。
- 智能信号: 动态文本在高区间市场时变为 绿色,市场失去动能时变为 红色。
- 简洁界面: 极简设计,完美融合任何技术分析设置。
- 高级优化: 轻量级代码,兼容最新 cTrader 版本(5.5.13)。
您风险管理的基础,现在拥有完全的视觉清晰度。
摘要
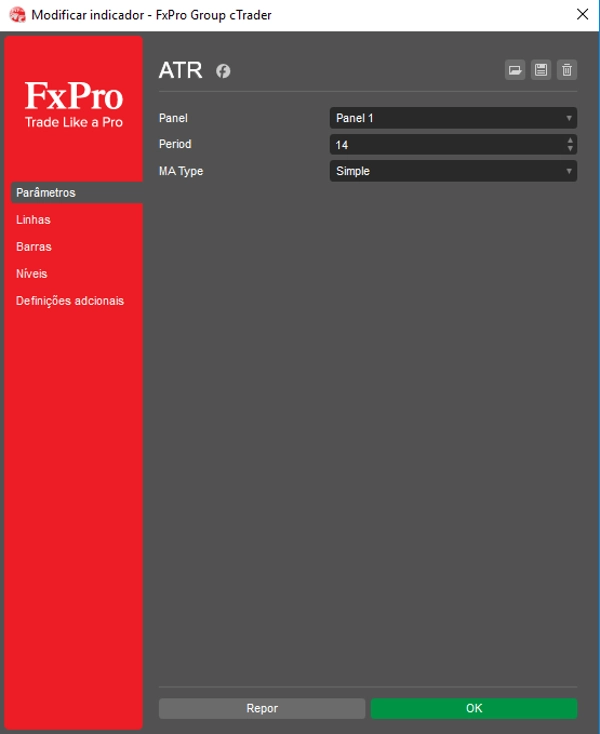
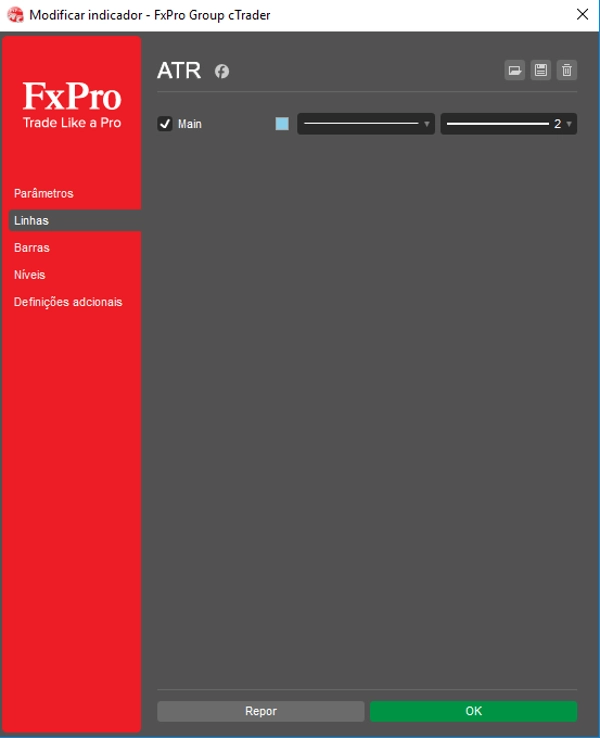
指标配置
客户评价
4.5
评价:2
5 | 50 % | |
4 | 50 % | |
3 | 0 % | |
2 | 0 % | |
1 | 0 % |
讨论
常见问答
BTCUSD
Forex
Signal
Breakout
Indices
EURUSD
Commodities
GBPUSD
NZDUSD
Prop
Scalping
Crypto
Stocks
XAUUSD
NAS100
ATR
USDJPY
cTrader Store 提供的所有产品,包括交易机器人、指标和插件,均由第三方开发者提供,仅供信息参考和技术访问之用。cTrader Store 并非经纪商,不提供投资建议、个人推荐或任何未来业绩保证。
该作者的其他作品


猜您喜欢


!["[Stellar Strategies] Inside Bar with Signals" 标识](https://cdn.ctrader.com/image/webp/1d9e8bfa-3b2c-4440-bb37-5856902008a7_30683)


价格
注册日期 05/02/2025
30
销售