
说明
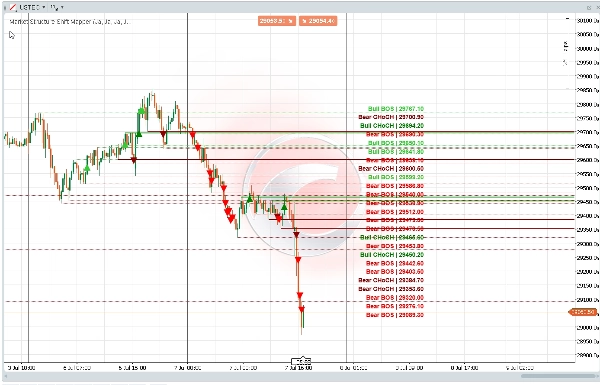
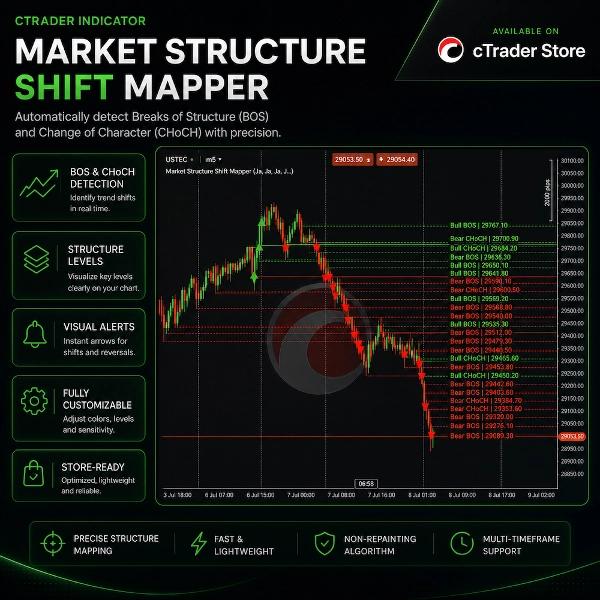
市场结构转变映射器是一个可视化的cTrader指标,旨在直接在您的图表上识别结构突破和市场结构转变。
该指标检测摆动高点和摆动低点,然后在价格突破相关结构水平时标记看涨和看跌的BOS或CHoCH事件。它可以显示结构线、突破箭头和干净的右侧标签,并通过堆叠标签布局减少视觉重叠。
该工具设计用于自由裁量的价格行为分析、市场结构回顾、基于流动性的图表准备和回测研究。
主要功能:
- 看涨BOS检测
- 看跌BOS检测
- 看涨CHoCH检测
- 看跌CHoCH检测
- 摆动高点和摆动低点检测
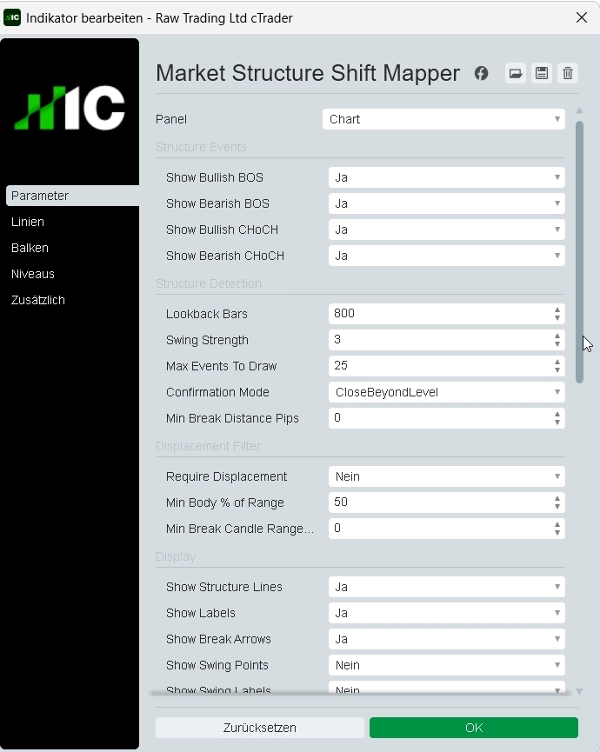
- 基于收盘价或影线的确认
- 可选位移过滤器
- 结构突破箭头
- 结构水平线
- 可选摆动点标记
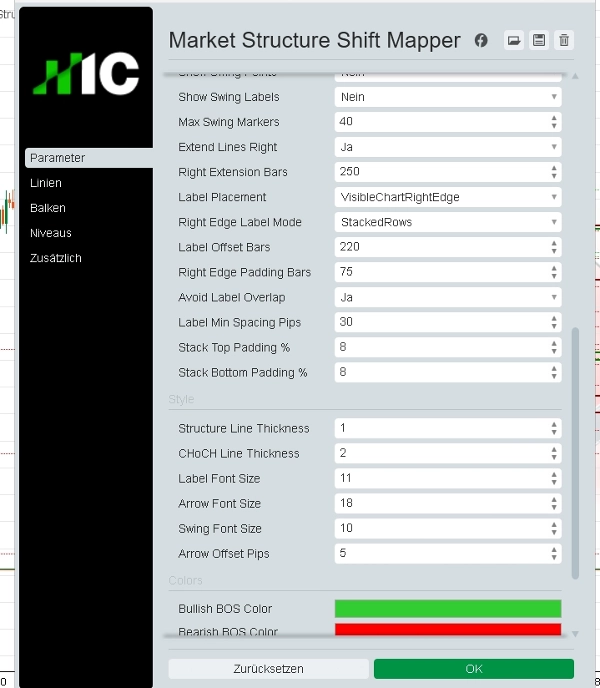
- 右侧堆叠标签
- 标签重叠保护
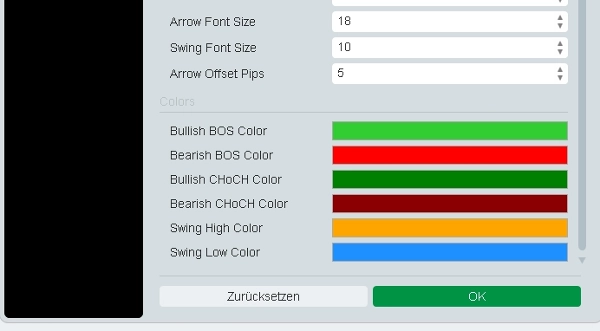
- 自定义颜色和线条设置
- 干净的图表叠加
- 具有受限访问权限的商店安全指标
市场结构转变映射器不是交易机器人。它不执行交易、不修改订单,也不提供保证的买卖信号。它仅是一个可视化分析和市场背景工具。
交易涉及风险。该指标不提供财务建议、投资推荐、统计概率或保证的交易结果。
摘要
AI summary
Market Structure Shift Mapper is a visual indicator for the cTrader platform that identifies and maps key market structure events directly on price charts. It detects swing highs and lows, then highlights bullish and bearish Break of Structure (BOS) and Change of Character (CHoCH) events when price breaks relevant levels. The indicator visually displays structure lines, break arrows, and right-edge stacked labels designed to minimize overlap for clearer chart interpretation.
Key features include:
- Detection of bullish and bearish BOS and CHoCH
- Swing high and low identification
- Close-based or wick-based confirmation options
- Optional displacement filtering
- Visual markers for structure breaks and swing points
- Customizable colors and line styles
- Clean chart overlay with label overlap protection
This tool supports discretionary price action analysis, market structure review, liquidity-based chart preparation, and backtesting research. It functions solely as a visual analysis aid and does not execute trades, modify orders, or provide trading signals or financial advice.
Key features include:
- Detection of bullish and bearish BOS and CHoCH
- Swing high and low identification
- Close-based or wick-based confirmation options
- Optional displacement filtering
- Visual markers for structure breaks and swing points
- Customizable colors and line styles
- Clean chart overlay with label overlap protection
This tool supports discretionary price action analysis, market structure review, liquidity-based chart preparation, and backtesting research. It functions solely as a visual analysis aid and does not execute trades, modify orders, or provide trading signals or financial advice.
指标配置
指标分类
市场结构(SMC)
输出类型
可视化
数据要求
仅 K 线
支持的信号
触及水平位
突破水平位
背离
趋势强度
客户评价
5.0
评价:1
5 | 100 % | |
4 | 0 % | |
3 | 0 % | |
2 | 0 % | |
1 | 0 % |
客户评价
July 19, 2026
Market Structure Shift Mapper is a clean, highly effective SMC tool for cTrader. It detects swing points and auto-labels BOS/CHoCH events. The label overlap protection keeps the chart readable, while the displacement filter and close/wick confirmations give excellent signal control. Though the last swing repaints until confirmed and alerts are missing, it’s a top-tier visual mapper for price action and liquidity-based trading.
讨论
常见问答
Key Levels
MSS
BOS
CHOCH
Market Structure
cTrader Store 提供的所有产品,包括交易机器人、指标和插件,均由第三方开发者提供,仅供信息参考和技术访问之用。cTrader Store 并非经纪商,不提供投资建议、个人推荐或任何未来业绩保证。