Description
Overview
FVG Mitigation Pro separates macro structural detection from lower-timeframe mitigation tracking. Standard Fair Value Gap scripts plot static rectangles on a single chart timeframe, leaving traders with cluttered screens and no quantitative measure of how deeply price has penetrated an active imbalance.
FVG Mitigation Pro solves this by scanning closed candles on your chosen Higher Timeframe (such as H1, H4, or D1) to isolate true three-candle price delivery inefficiencies, while monitoring mitigation tick-by-tick using your active Lower Timeframe chart. The result is macro structural context combined with granular execution precision.
Core Capabilities
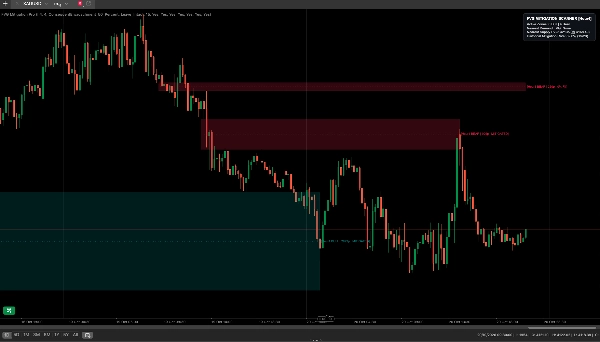
- True Multi-Timeframe Synchronization: Evaluates closed Higher Timeframe (HTF) intervals to prevent premature zone plotting and look-ahead bias, projecting macro demand (BISI) and supply (SIBI) imbalances directly onto your M1, M5, or M15 execution chart.
- 4 Selectable Mitigation Algorithms: Customize how the engine defines a mitigated imbalance to match your exact trading model:
- Proximal Touch (0%): Marks the zone mitigated upon the very first touch of the entry boundary.
- Consequent Encroachment (50% Midpoint): Invalidates the zone the moment price reaches the geometric 50% equilibrium line.
- Full Fill (100%): Keeps the imbalance active until price traverses the entire gap to touch the distal boundary.
- Close Beyond Midpoint: Requires a base-timeframe candle body to close past the 50% CE threshold, filtering out brief liquidity-sweep wicks.
- 3 Post-Mitigation Display States: Control chart hygiene after an imbalance is filled:
- Clean (Delete): Removes the box, midline, and label immediately to preserve an uncluttered execution workspace.
- Fade (Dimmed History): Terminates the zone projection at the exact mitigation bar and reduces opacity to a subtle watermark for historical review.
- Leave Intact: Terminates the projection at the mitigation bar while retaining full color saturation and the 50% CE line—ideal for tracking Inversion Fair Value Gaps (IFVGs).
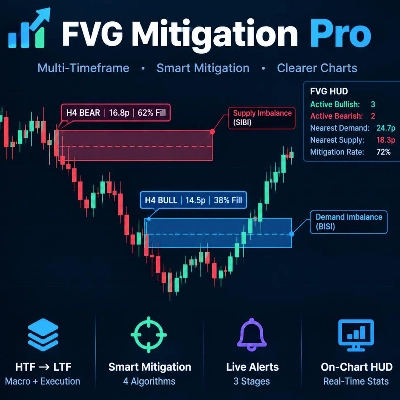
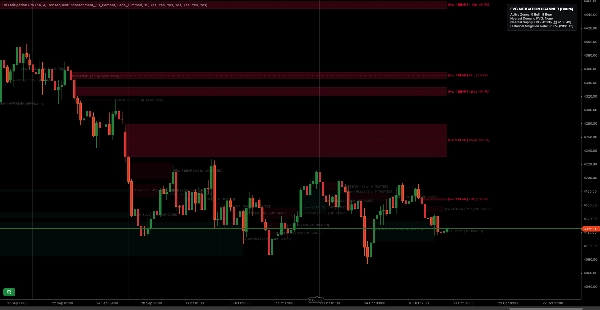
- Live Fill-Depth Telemetry & 50% CE Line: Every active FVG displays an internal dashed 50% Consequent Encroachment line alongside a real-time tag showing the source timeframe, initial gap size in pips, and maximum percentage fill achieved so far (e.g.,
[h4 BULL |14.5p| 38% Fill]). - 3-Stage Native Notification Engine (Zero Initialization Spam): An internal state gate suppresses historical alerts when loading a chart, firing native cTrader popups, audio cues, and detailed log entries strictly on live market events:
- Stage 1: New FVG Formed: Alerts when a new HTF imbalance closes, reporting exact price boundaries and the 50% CE coordinate.
- Stage 2: First Zone Tap (Armed): Triggers the moment price first breaches the proximal edge of an untouched FVG, signaling you to monitor lower-timeframe market structure.
- Stage 3: Mitigation Confirmed: Logs the completion of the fill alongside the number of base-chart bars the imbalance survived.
- On-Chart Statistical HUD: A compact corner telemetry panel displays the count of active bullish and bearish zones, exact pip distance and price coordinate to the nearest upper supply and lower demand imbalances, and the empirical historical mitigation rate across the loaded chart history.
- Safe & Lightweight Architecture (
AccessRights.None): Requires zero external file, network, or system permissions. Historical mitigated zones are bypassed in the calculation loop to ensure minimal CPU usage during volatile sessions.
Parameter Reference
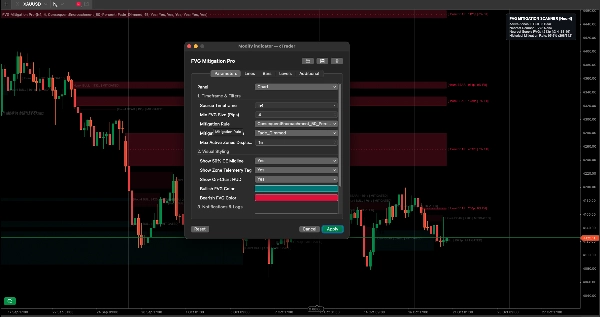
1. Timeframe & Filters
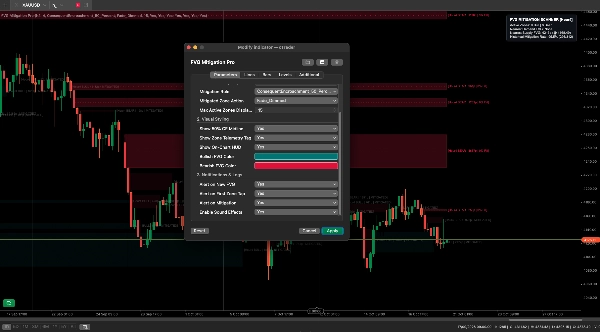
Source Timeframe: The Higher Timeframe scanned for 3-candle imbalances (e.g., h1, h4, d1).
Min FVG Size (Pips): Filters out micro-gaps smaller than the specified pip threshold.
Mitigation Rule: Selects between
1. ProximalTouch_0_Percent
2. ConsequentEncroachment_50_Percent
3. FullFill_100_Percent, or CloseBeyondMidpoint.
Mitigated Zone Action: Selects between
1. Clean_Delete
2. Fade_Dimmed
3. Leave_Intact.
Max Active Zones Displayed: Caps the number of simultaneous unmitigated zones rendered on screen.
2. Visual Styling
Show 50% CE Midline: Toggles the internal dashed Consequent Encroachment equilibrium line.
Show Zone Telemetry Tag: Toggles the inline text tag showing gap size and live fill percentage.
Show On-Chart HUD: Toggles the top-right statistical telemetry dashboard.
Bullish / Bearish Color: Full color picker support for demand and supply imbalances.
3. Notifications & Logs
Alert on New FVG: Triggers a popup and log entry when a new HTF imbalance confirms.
Alert on First Zone Tap: Triggers an alert the first time price enters an unmitigated zone.
Alert on Mitigation: Triggers a completion alert and logs survival duration when mitigated.
Enable Sound Effects: Toggles native cTrader audio cues for each alert stage.
Summary
Key features include four selectable mitigation algorithms to define when an imbalance is considered filled: Proximal Touch (0%), Consequent Encroachment (50% midpoint), Full Fill (100%), and Close Beyond Midpoint. Users can control how mitigated zones are displayed post-fill, choosing to delete, fade, or leave them intact for ongoing analysis.
The indicator provides live fill-depth telemetry with a 50% Consequent Encroachment line and real-time tags showing source timeframe, initial gap size in pips, and fill percentage. A native 3-stage alert system notifies users on new FVG formation, first zone tap, and confirmed mitigation, with options for popups, audio cues, and logs.
An on-chart statistical HUD displays counts of active bullish and bearish zones, distances to nearest imbalances, and historical mitigation rates. The tool operates with minimal CPU usage and requires no external permissions, supporting clean and efficient chart analysis focused on market structure, supply and demand, and mitigation blocks.
Discussion
Customer reviews
5 | 100 % | |
4 | 0 % | |
3 | 0 % | |
2 | 0 % | |
1 | 0 % |