present
Sign up and get $50 off your first purchase
Trading product for Session Liquidity Pro Indicator Key Levels Liquidity Sweep, image 1
Session Liquidity Pro
Indicator
Version 1.0, Sep 2026
Windows, Mac
Trading product for Session Liquidity Pro Indicator Key Levels Liquidity Sweep, image 2
Trading product for Session Liquidity Pro Indicator Key Levels Liquidity Sweep, image 3
Trading product for Session Liquidity Pro Indicator Key Levels Liquidity Sweep, image 4
Trading product for Session Liquidity Pro Indicator Key Levels Liquidity Sweep, image 5
Since 10/12/2024
1
Sales

Description

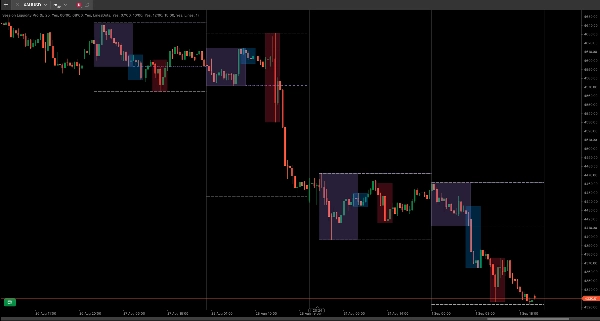
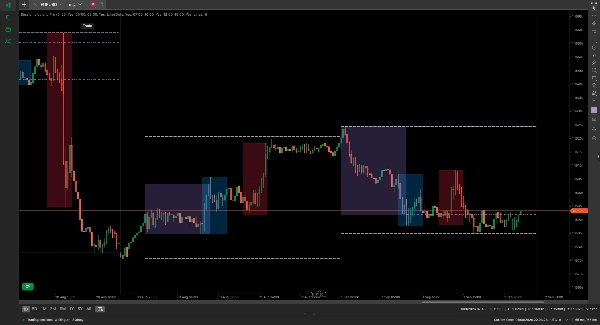
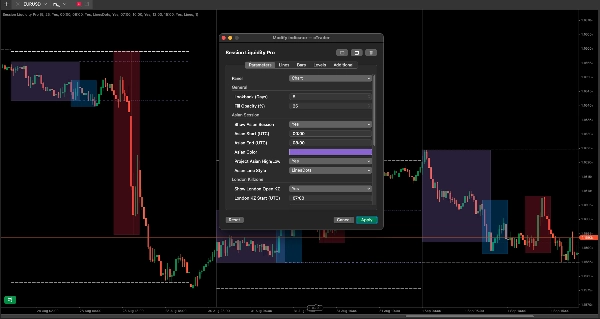
Session Liquidity Pro maps institutional market structure by consolidating daily session timing and structural liquidity targets into a single workspace. Instead of cluttering your charts with multiple overlapping tools, this indicator plots Asian, London, and New York killzones alongside forward-projected liquidity sweeps.

Many intraday execution models rely on price sweeping the Asian High/Low or the Previous Day High/Low (PDH/PDL) before expanding into a trend. This tool visually frames the specific time windows (the sessions) and the structural targets (the levels) required for these setups.

Key Features

  • Universal UTC Synchronization: Standardizes all server times to UTC, preventing misaligned killzones when switching between brokers with different time zones.
  • Asian Range Projections: Automatically extends Asian High and Low lines forward through the London and New York sessions to highlight liquidity sweep targets.
  • PDH & PDL Tracking: Plots Previous Day High and Low levels seamlessly across lower timeframes using native multi-timeframe data retrieval.
  • Weekend Filtering: Bypasses weekend gap data to prevent distorted session boxes and misaligned levels on Monday opens.
  • Namespace Isolation: All drawings are strictly tracked under custom tags, preventing interference with your manual chart markups.

Parameter Settings

  • Lookback (Days) (Default: 5) โ€” Limits historical rendering to a set number of days to preserve platform rendering speed.
  • Fill Opacity (%) (Default: 25) โ€” Adjusts the visual transparency of the shaded session boxes.
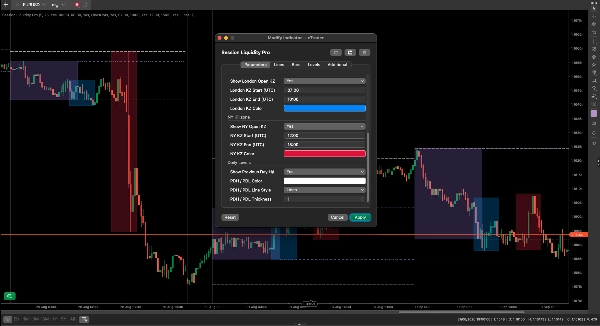
  • Show Asian Session (Default: True) โ€” Toggles the Asian range box. Includes custom settings for Start/End times (UTC) and box color.
  • Project Asian High/Low (Default: True) โ€” Enables forward-projected lines for the Asian session extremes, with customizable line styles.
  • Show London Open KZ (Default: True) โ€” Toggles the London killzone box and customizes the UTC timeframe and color.
  • Show NY Open KZ (Default: True) โ€” Toggles the New York killzone box and customizes the UTC timeframe and color.
  • Show Previous Day H/L (Default: True) โ€” Plots the PDH/PDL lines. Allows customization of line color, style, and thickness.


Feedback & Support 

Have a feature request or need help with your UTC settings? Reach out via the comments tab below. All future feature additions and maintenance patches are included for life after purchase.

Summary

AI summary
Session Liquidity Pro is an intraday market structure indicator designed to consolidate key trading sessions and liquidity targets into a single chart workspace. It visually maps institutional market structure by displaying Asian, London, and New York killzones alongside projected liquidity sweep levels such as the Asian session high/low and Previous Day High/Low (PDH/PDL). The indicator standardizes all session times to UTC to ensure alignment across brokers with different time zones. It automatically projects Asian range levels forward through subsequent sessions to highlight potential liquidity sweep targets. Weekend data is filtered to avoid distortions from gaps, and all drawings are managed under isolated namespaces to prevent interference with manual chart annotations. Users can customize session visibility, timeframes, colors, and opacity, as well as adjust lookback periods for historical data rendering. This tool supports multi-timeframe data retrieval for seamless plotting of key levels on lower timeframes. It is intended to assist traders in identifying critical intraday structural levels and time windows that are commonly used in execution models relying on price sweeps before trend expansions.
Indicator profile
Indicator category
Market structure (SMC)
Output type
Visualisation
Data requirements
Bars only
Supported signals
Session opening range

Customer reviews

0.0
Reviews: 0
Customer reviews
No reviews for this product yet. Already tried it? Be the first to tell others!

Discussion

FAQ

Key Levels
Liquidity Sweep
Market Structure
Support & Resistance
Products available through cTrader Store, including trading bots, indicators and plugins, are provided by third-party developers and made available for informational and technical access purposes only. cTrader Store is not a broker and does not provide investment advice, personal recommendations or any guarantee of future performance.

More from this author

Indicator
Key Levels
Support & Resistance
Clean psychological round-number grid with native pip and point auto-scaling across Forex, Gold, Indices, and Crypto.

You may also like

Indicator
AI
ATR
+27
The "Market Temperature" Moving Average -Turn Your MA Into a Live Market Temperature Line
Indicator
Shows BUY & SELL signals for 3 & 4 BAR PATTERN (Morning star/ Evening star). It is adjustable and it will SHOW ARROWS.
Indicator
ATR
RSI
+4
Adaptive Ichimoku with nine-factor confluence scoring, five signal types, smart TP/SL and an MTF panel.
Indicator
Prop
Forex
+12
Introducing High Accuracy multi timeframe Swing high and low detector.
Indicator
AI
RSI
+7
EMA MTF TREND PRO - Multi-timeframe trend analysis overlay indicator, 6 timeframes - in one table with ADX
Indicator
ATR
SMC
+20
Session boxes, liquidity sweeps and higherโ€‘timeframe levels for intraday trading
Indicator
ADX
ATR
+5
EMA-cross signals scored on six confluence layers, with an ATR stop, three targets and a live panel
Indicator
Forex
Indices
+5
Market Profile TPO for cTrader โ€” full auction logic, IB, POC, VA zones, histogram and O/X markers with time
Indicator
EMA
RSI
+5
MACD Colour Histogram with 11 Moving Average Types, Multi-timeframe confirmation and Sound Signal Alert.
Indicator
ATR
RSI
+4
RSI bands drawn on price, confluence-scored BUY/SELL signals, an ATR stop with three targets
Indicator
MSS
VWAP
+5
VWAP mean-reversion signals combined with a ribbon-anchored volume profile, VAH/VAL, POC and HVN levels.
Indicator
ATR
EMA
+2
Eight-EMA ribbon with ATR trade zones, a nine-symbol screener and a five-timeframe trend dashboard.
Indicator
Volume
Key Levels
+1
Fixed-grid volume profile: bull and bear volume at every price level, with Point of Control and value area.
Indicator
Volume
Key Levels
Dynamic Visible Range Volume Profile for cTrader. Real-time POC, Value Area & Smart Alerts for precise trading.
Indicator
ADX
ATR
+5
Range-filter BUY/SELL flips with an ATR or swing stop, three targets, five confluence stars and a live panel
Indicator
EMA
Forex
+5
ALMA Smoothed Gaussian Moving Average (ASGMA) โ€“ by LudwigICT
Indicator
Forex
Crypto
+2
PREMIUN INDICATOR
Indicator
Prop
Forex
+11
๐ŸŒŠ See when the market is truly in play. Tsunami measures Relative Volume by time-of-day ๐ŸŒŠ

Price

Since 10/12/2024
1
Sales