present
注册即可在首次购物时获得 $50 优惠
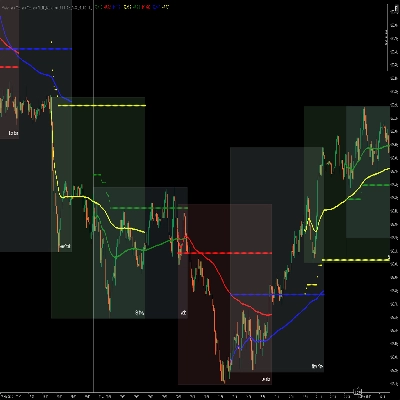
Trading product for Atomic Analyst 指标 Key Levels, image 1
Atomic Analyst
指标
版本 1.1, Oct 2026
Windows 版、Mac 版
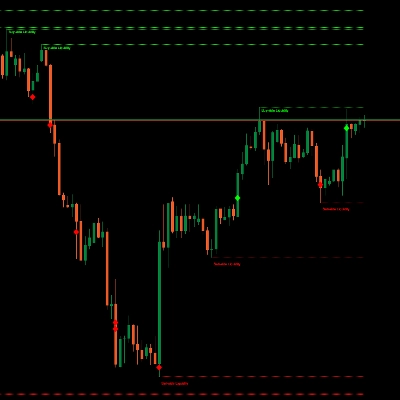
Trading product for Atomic Analyst 指标 Key Levels, image 2
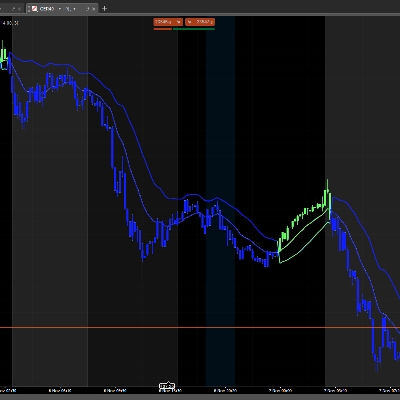
Trading product for Atomic Analyst 指标 Key Levels, image 3
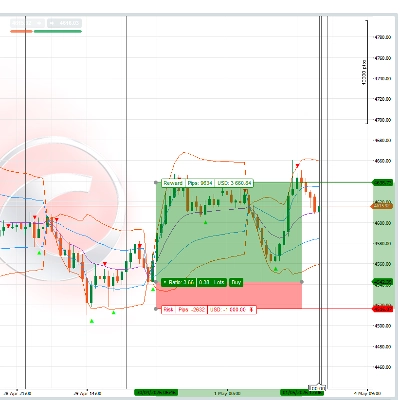
Trading product for Atomic Analyst 指标 Key Levels, image 4
注册日期 16/10/2026

说明

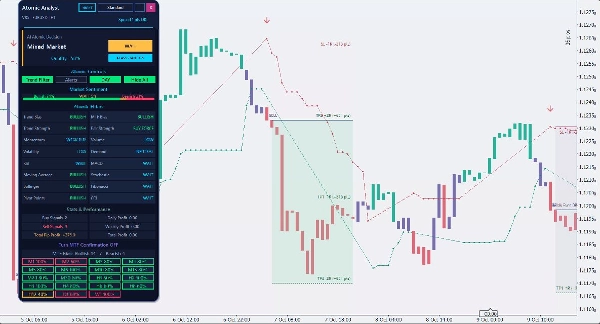
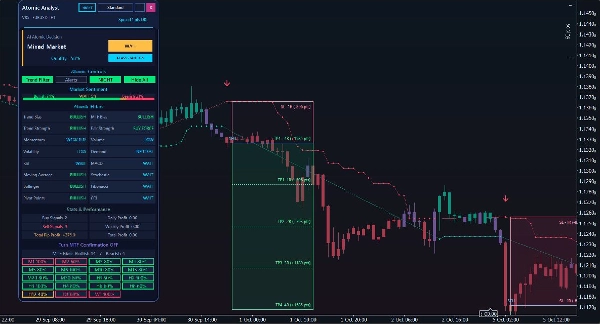
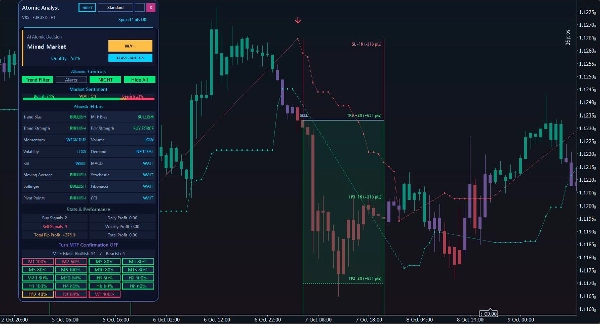
Atomic Analyst 将趋势背景、交易计划和多时间框架分析整合到一个交互式 cTrader 指标中。其可移动的图表面板帮助您在决定是否操作之前审查市场。


读取趋势

使用趋势过滤器专注于基于趋势的买卖信号。一起审查趋势偏向、强度、动量、波动性及支持的技术过滤器。多时间框架单元格提供支持的图表周期的额外背景。


直观规划交易

直接在图表上查看指示的入场、止损和获利水平。透明的交易玻璃框保持蜡烛图可见,同时显示分析计划及其历史进展。目标、保本和止损结果帮助您回顾所选设置的发展情况。


保持工作区清晰

移动或折叠面板,选择其显示大小,并使用日间、夜间或自定义图表主题。从面板切换图表视觉效果和提醒。提供桌面弹出、声音和可配置的电子邮件提醒;电子邮件需要您的 cTrader 邮件设置。


开始使用

将 Atomic Analyst 附加到 cTrader Windows 时间基图表,并允许其历史数据加载完成。H1 是审查此处提供示例的实用起点。选择趋势过滤器,检查信号及其风险水平,并在做出自己的决定之前评估更广泛的市场。画廊使用 EURUSD H1;经纪商数据、设置、点差和交易成本可能会改变您看到的结果。请先在模拟账户上测试您选择的工具和设置。


理解显示内容

Atomic Analyst 是一个分析指标;它不会为您下单。AI 助手和质量读取总结技术一致性,而非盈利概率。历史交易玻璃结果是分析示例,而非经过验证的账户回报或执行回测。画廊故意选择获胜示例来展示界面;也会出现亏损和平盘信号。即使图表滚动到过去,面板仍显示其当前市场评估。


交易涉及风险。过去的表现不保证未来结果。

摘要

指标配置
指标分类
趋势
输出类型
可视化
信号
数据要求
仅 K 线
支持的信号
趋势强度

讨论

客户评价

0.0
评价:0
客户评价
该产品尚无评价。已经试过了?抢先告诉其他人!

常见问答

Key Levels
cTrader Store 提供的所有产品,包括交易机器人、指标和插件,均由第三方开发者提供,仅供信息参考和技术访问之用。cTrader Store 并非经纪商,不提供投资建议、个人推荐或任何未来业绩保证。

该作者的其他作品

指标
RSI
VWAP
+5
Trend direction, chart signals, reversal zones and volume tools in one configurable indicator.
指标
Volume
Order Block
+3
Map market structure, order blocks, liquidity and key zones with an interactive cTrader dashboard.
指标
Volume
Key Levels
+1
Six timeframe decisions, chart trade plans and historical risk simulation in one interactive cTrader indicator.
指标
Volume
Support & Resistance
Compare up to 27 symbols across eight timeframes with seven analysis engines and an interactive cTrader dashboard.
指标
Fibonacci
Key Levels
+1
Explore Elliott wave counts, three swing sizes and example levels with an interactive cTrader chart panel.
指标
ATR
Key Levels
+1
Explore 88 harmonic price-pattern variants with interactive chart controls and geometric reference levels.

猜您喜欢

指标
EMA
MACD
+5
Multi-timeframe MACD with color-changing line, 4-color histogram & triangle signals.
指标
ATR
BOS
+5
Market structure with BOS and CHoCH, order blocks, and retest buy/sell arrows with entry, stop and two targets
指标
SMC
Prop
+13
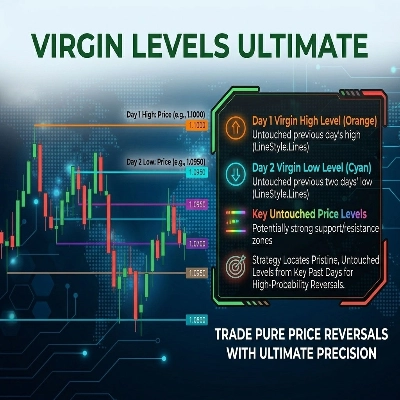
Tracks virgin levels. Lines vanish only after a candle closes beyond the high/low on your chosen timeframe.
指标
ATR
SMC
+18
Super Wick detects powerful candle rejections: fractal long-wicks, HTF resonance zones, and a WSI gauge.
指标
Forex
EURUSD
+3
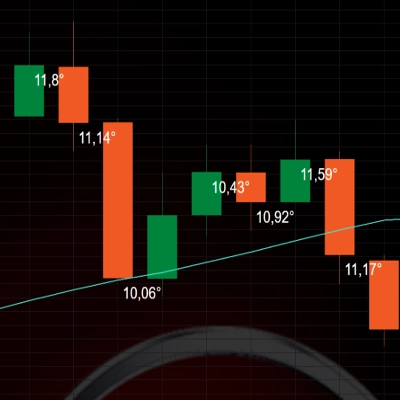
ATR-normalized MA slope in degrees, comparable across all instruments. Color-coded labels flag strong trend moves.
指标
Track VWAP for Asia, London, NY, Sydney, Daily, Weekly, Monthly & Custom Sessions. Perfect for FX & intraday trading!
指标
Forex
BTCUSD
+5
Buy-Side & Sell-Side Liquidity (BSL/SSL) Indicator
指标
Volume
Support & Resistance
Compare up to 27 symbols across eight timeframes with seven analysis engines and an interactive cTrader dashboard.
指标
Forex
Crypto
+3
Perfect Trend
指标
Supertrend
Moving Average
Easy Trade: Trend & Breakout Indicator for cTrader
指标
VWAP
Volume
+2
VWAP Bands and Swing Wick Structure Indicator
指标
RSI
SMC
+17
RSI, MACD, Stochastic, CCI & Momentum divergence scanner with confluence scoring. Never miss a signal again!
指标
Forex
Crypto
+4
Auto-detect support and resistance & trendlines, highlight pullbacks/BOS retests, and filter with candle confirmation.
指标
Fibonacci
Key Levels
+1
Explore Elliott wave counts, three swing sizes and example levels with an interactive cTrader chart panel.
指标
AI
SMC
+18
ICT HTF Candles- The Ultimate Multi-Timeframe Dashboard Stop switching timeframes and losing focus.
指标
Forex
Crypto
+3
ICT Advanced Swings Indicator – Multi-Timeframe Precision
指标
ATR
Key Levels
+1
Explore 88 harmonic price-pattern variants with interactive chart controls and geometric reference levels.
指标
Prop
Forex
+13
⚔️Full breakout trading workstation: session box, EP/TP/SL levels, on-chart ✓/✗ outcomes, pro-level analytics and more⚔️

价格

注册日期 16/10/2026