

Opis
Kluczowe funkcje
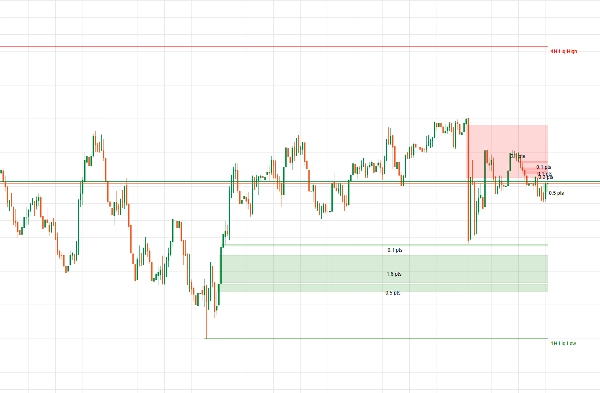
- Płynność wieloczasowa: Automatycznie rysuje poziomy strukturalne high/low 1H i 4H na wykresach o niższym interwale czasowym. Gdy cena przebija te poziomy, są one albo natychmiast usuwane, albo zamrażane, aby oznaczyć stop-run.
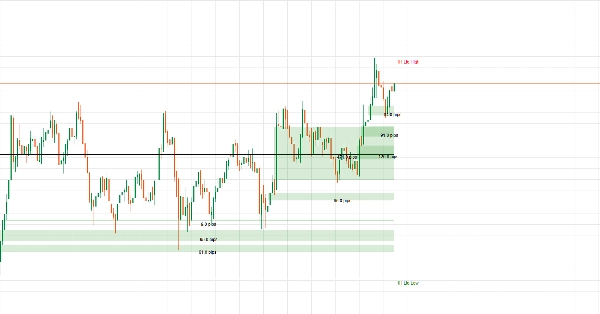
- Inteligentne bloki FVG i inwersji: Rysuje luki wartości godziwej jako solidne, wypełnione kolorowe pola zamiast pustych linii. Luki rozszerzają się do przodu bez ograniczeń, aż zamknięcie świecy całkowicie je przebije (Inversed FVG).
- Precyzyjny licznik pipsów: Wyświetla dokładny rozmiar każdej luki z dokładnością do jednego miejsca po przecinku (np.
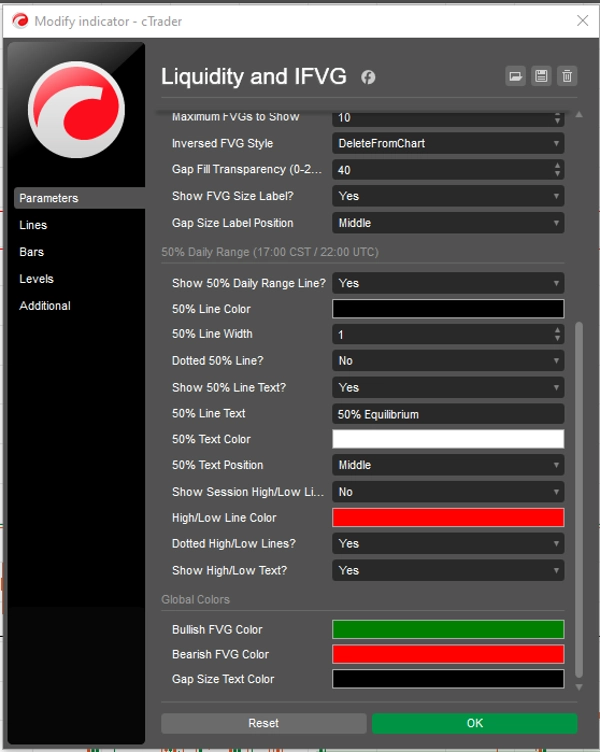
14.3 pips), dzięki czemu możesz natychmiast ocenić wielkość nierównowagi na rynku. - Strefa równowagi dziennej 50%: Rysuje dzienny High, Low oraz dokładny punkt środkowy 50% (resetowany o 17:00 CST / 22:00 UTC podczas rollover bankowego), aby pokazać, czy cena znajduje się w strefie Premium czy Discount.
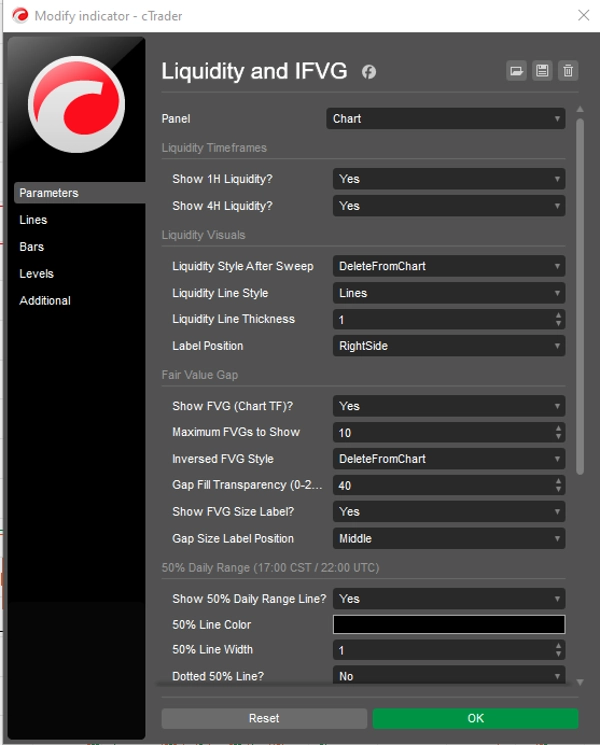
- Pełna kontrola wydajności: Zawiera wbudowane rozwijane wybieraki kolorów, regulowane przezroczystości tła, trójstronne wyrównania tekstu oraz parametr limitu liczby FVG, aby utrzymać szybkie działanie platformy.
Podsumowanie
AI summary
This indicator integrates Multi-Timeframe Liquidity tracking, dynamic Fair Value Gap (FVG) visualization, and a 50% Daily Range equilibrium zone to assist market structure analysis. It automatically plots 1-hour and 4-hour structural high and low levels on lower timeframe charts, highlighting liquidity sweeps that either erase or freeze to indicate stop-run events. Fair Value Gaps are displayed as solid, filled color boxes extending forward until fully broken by candle closes, with precise pip measurements provided for each gap to quantify market imbalances. The indicator also marks the active day's High, Low, and exact 50% midpoint, resetting daily at the 17:00 CST/22:00 UTC banking rollover, to identify premium and discount price zones. Users can customize visual elements including color schemes, background opacity, text alignment, and set a cap on the number of FVGs displayed to optimize performance. This tool supports visualization outputs and is designed for use with bar and tick data, aiding in reversal signal identification within market structure and smart money concepts frameworks.
Profil wskaźnika
Kategoria wskaźnika
Struktura rynku (SMC)
Typ wyjścia
Wizualizacja
Wymagania dotyczące danych
Tylko słupki
Dane tickowe
Obsługiwane sygnały
Odwrócenie trendu
Opinie klientów
0.0
Opinie: 0
Opinie klientów
Ten produkt nie ma jeszcze opinii. Wypróbowałeś(-aś) go już? Bądź pierwszy(-a) i powiedz o tym innym!
Dyskusja
Częste pytania
Premium/Discount
Fair Value Gap
Key Levels
Liquidity Sweep
Imbalance
Liquidity Grab
Produkty dostępne za pośrednictwem cTrader Store, w tym boty handlowe, wskaźniki i wtyczki, dostarczane są przez deweloperów zewnętrznych i udostępniane wyłącznie w celach informacyjnych oraz w celu zapewnienia dostępu technicznego. cTrader Store nie jest brokerem i nie zapewnia doradztwa inwestycyjnego, nie udziela spersonalizowanych rekomendacji ani nie gwarantuje przyszłych wyników.






















Cena
Od 30/05/2025
42
Sprzedaż